Forty-one objections to a literal global flood and ark voyage, with sourced animal counts and calculations for space, food, labour, timber, and construction, followed by five claims of supposed supporting evidence.
A flood that drowned every mountain, killed everyone outside one boat, and made eight people the ancestors of all later humanity would have changed almost everything we can study about the recent past. Forests would have died. Lakes would have been invaded. Civilizations would have ended together. Human and animal ancestry would have passed through an extraordinary worldwide bottleneck.
That is not the history recorded in the evidence.
This article examines the literal global-flood reading of Genesis 6-8. The story describes mountain-covering water, the destruction of land-dwelling life outside the ark, and confinement lasting roughly a year. It is often placed a few thousand years ago. The familiar date of 2348 BCE belongs to Ussher's biblical chronology and is defended in Answers in Genesis's flood timeline. Genesis itself does not supply a BCE date.
The 41 numbered sections present the scientific, historical, physical, and logistical case against a literal global flood and ark voyage. They include the practical problems of housing, feeding, and caring for the animals, as well as objections to proposed flood mechanisms. The arguments vary in strength and sometimes overlap. Each section explains what its evidence establishes and where its conclusions depend on particular assumptions.
Five claims offered as positive evidence for Noah's ark appear separately at the end under "debunking common rebuttals." Examples include marine fossils on mountains and the boat-shaped formation in Turkey. Explaining why those observations do not establish a global flood removes claimed support for the story; those five responses are excluded from the title's count.
Most cited researchers were studying climate, ancestry, rocks, or ancient societies, rather than Noah. The application of their findings to the flood claim is explained here. Where a calculation or conclusion is this article's inference, it is identified as such. The engineering examples use stated assumptions and compare alternatives; they are not measurements of an actual ark. A metric tonne means 1,000 kg. Sections 36-41 use a consistent 6,744-animal inventory unless a separate species scenario is explicitly identified.
A regional flood, an ancient flood survivor, and a symbolic religious narrative are different propositions. An unrestricted miracle that also removes every trace of the event cannot be tested scientifically. A worldwide catastrophe offered as physical history can be tested, and it fails those tests.
1. Tree-ring calendars continue through the supposed flood
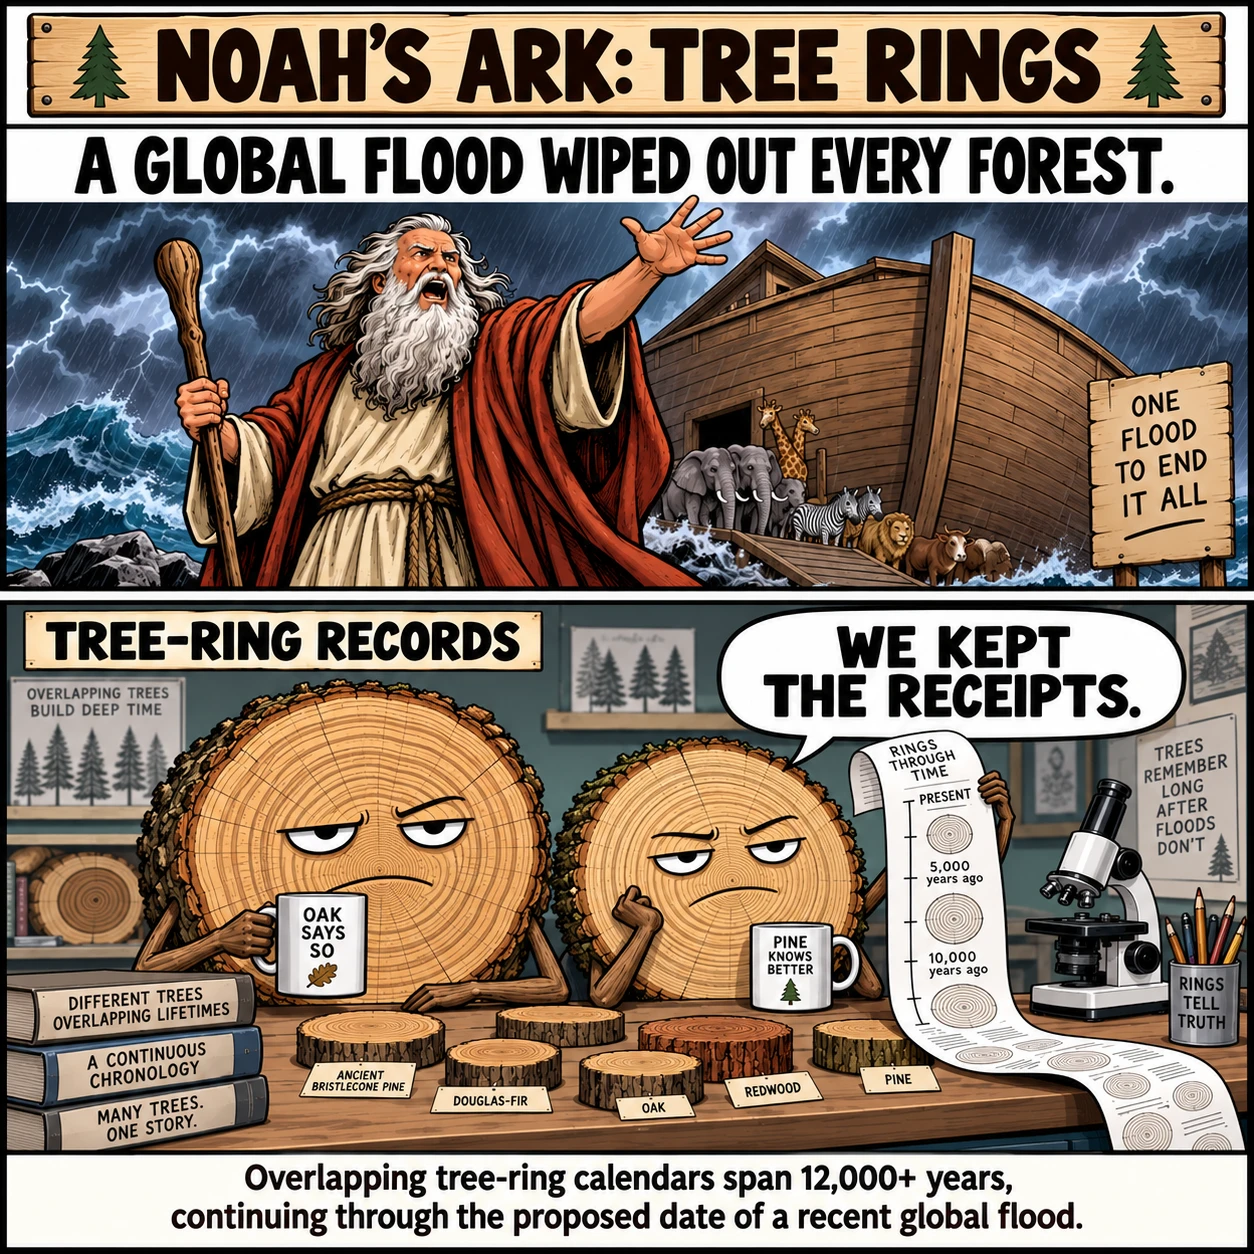
Trees record sequences of good and bad growing seasons in their rings. Researchers match distinctive patterns between living trees and older wood, extending a calendar backward through overlapping lifetimes. This does not require one tree to survive for the whole interval.
The Hohenheim oak and pine chronology establishes an annually resolved central European record reaching more than 12,000 years into the past. Its construction includes checks on difficult matches and revisions when additional wood improves the sequence. These are measured growth histories, not ages assigned by assuming that Noah never existed.
The conflict is straightforward. Trees growing across the proposed flood date continued recording terrestrial seasons. A year of deep global submergence and destruction of land ecosystems would interrupt that continuity. Occasional missing or extra rings are real problems, but cross-matching many specimens addresses them. They do not plausibly turn thousands of matched growing seasons into one catastrophic year.
2. Greenland's ice preserves successive seasons, not a recent ocean invasion
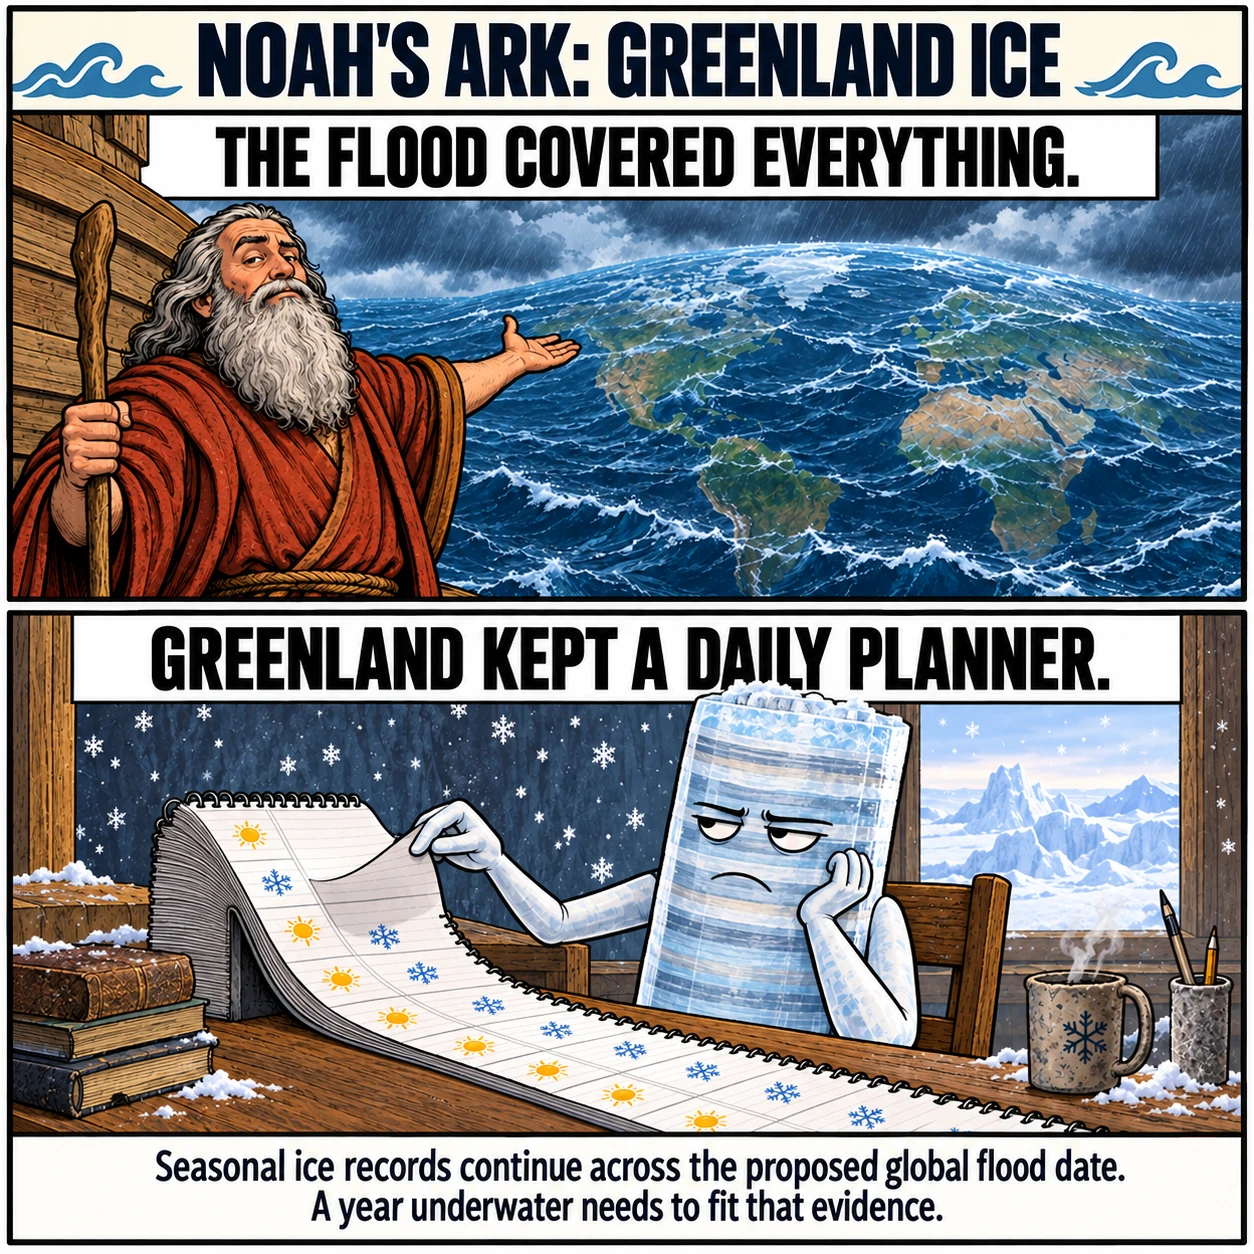
Greenland ice cores contain seasonal changes in dust, isotopes, and other substances. Researchers identify annual layers using several measurements and compare separate cores using shared volcanic markers. The GICC05 chronology extends annual counting back about 60,000 years, with stated uncertainties.
A mountain-covering flood a few thousand years ago would inundate the ice sheet's accumulation areas. A model must explain how deep moving water, buoyancy, heat exchange, and sediment transport left a sequence that continues to look like snow accumulating through ordinary seasons. Merely asserting that the ice already existed does not answer this problem. The relevant evidence includes layers spanning the proposed event.
Nor can every visible band simply be called another storm. The chronology uses seasonal chemistry and comparisons among cores, rather than treating every stripe as a year. Its recent portion cannot be compressed into a brief flood without destroying the agreement among those observations.
3. Antarctic ice supplies another long climate history
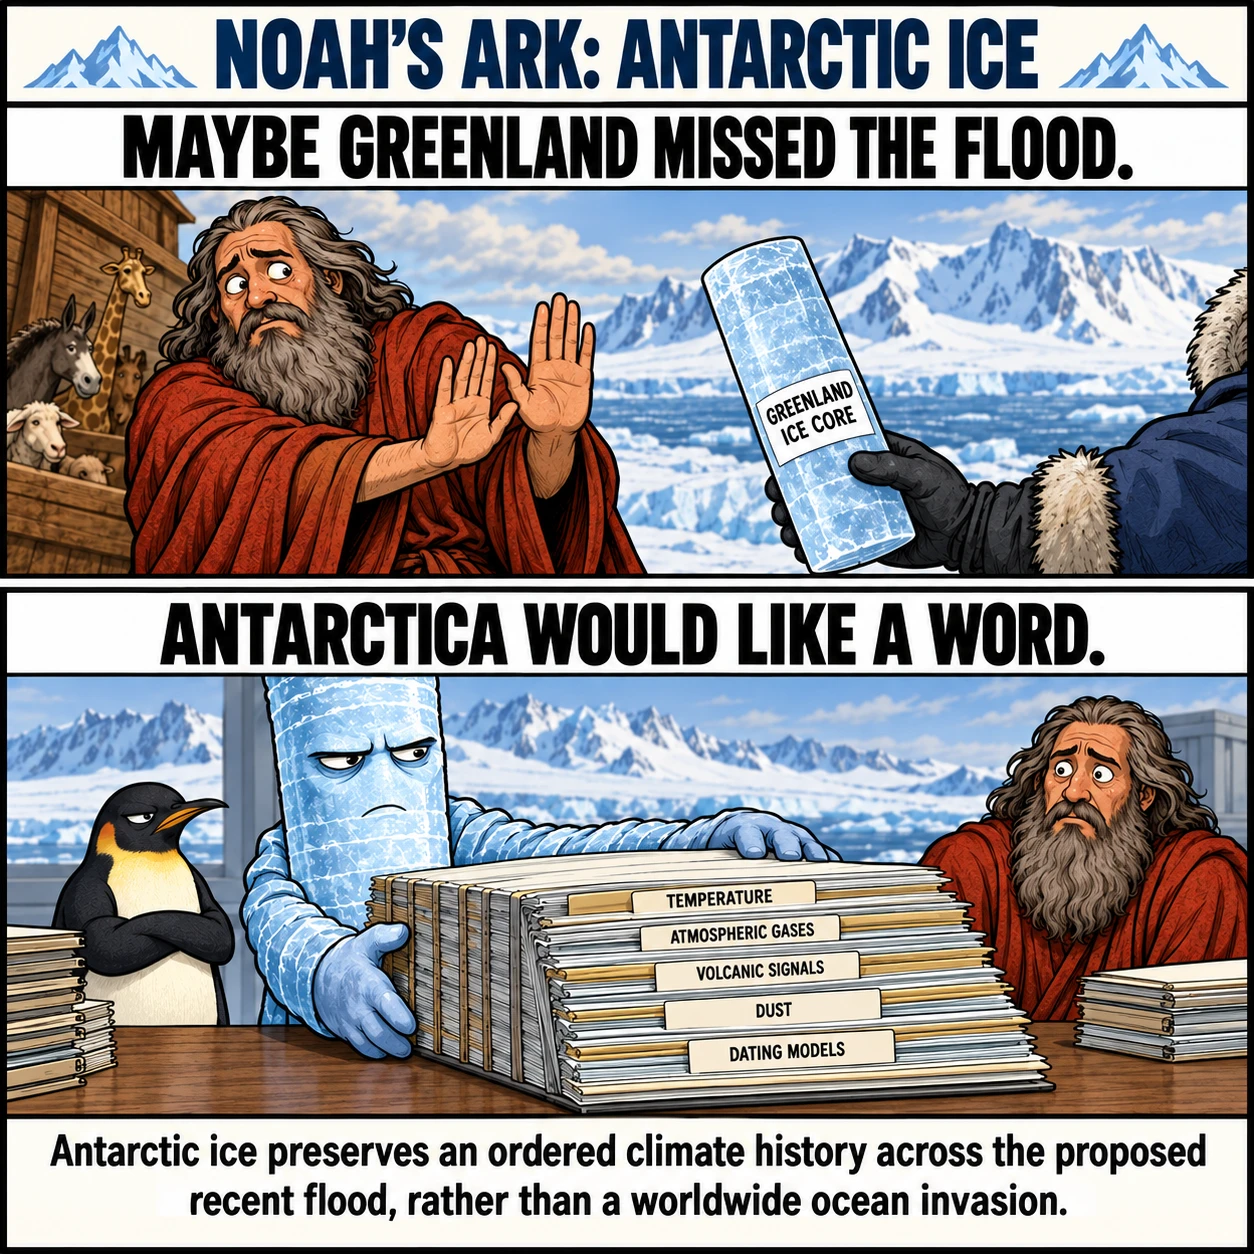
Antarctica provides a separate test on the other side of the planet. The established EPICA Dome C record extends through roughly 800,000 years of climate history, including repeated cold and warm periods. Its upper layers also span the recent millennia in which a literal biblical flood is usually placed.
Scientists do not count 800,000 perfectly visible annual bands. Dating deep Antarctic ice combines measurements, models of accumulation and ice flow, and comparisons with other dated records. Trapped air can be younger than its surrounding ice because snow takes time to seal into ice. Those distinctions are part of the method.
The problem for a global flood is the preservation of an ordered snow-and-atmosphere record through the alleged worldwide inundation. Rebuilding an ice sheet after the flood would not reproduce the observed sequence of old ice, younger ice, trapped gases, and changing climate. Preserving it in place beneath a global ocean requires an explanation the flood narrative does not provide.
4. Lake sediments record tens of thousands of seasons
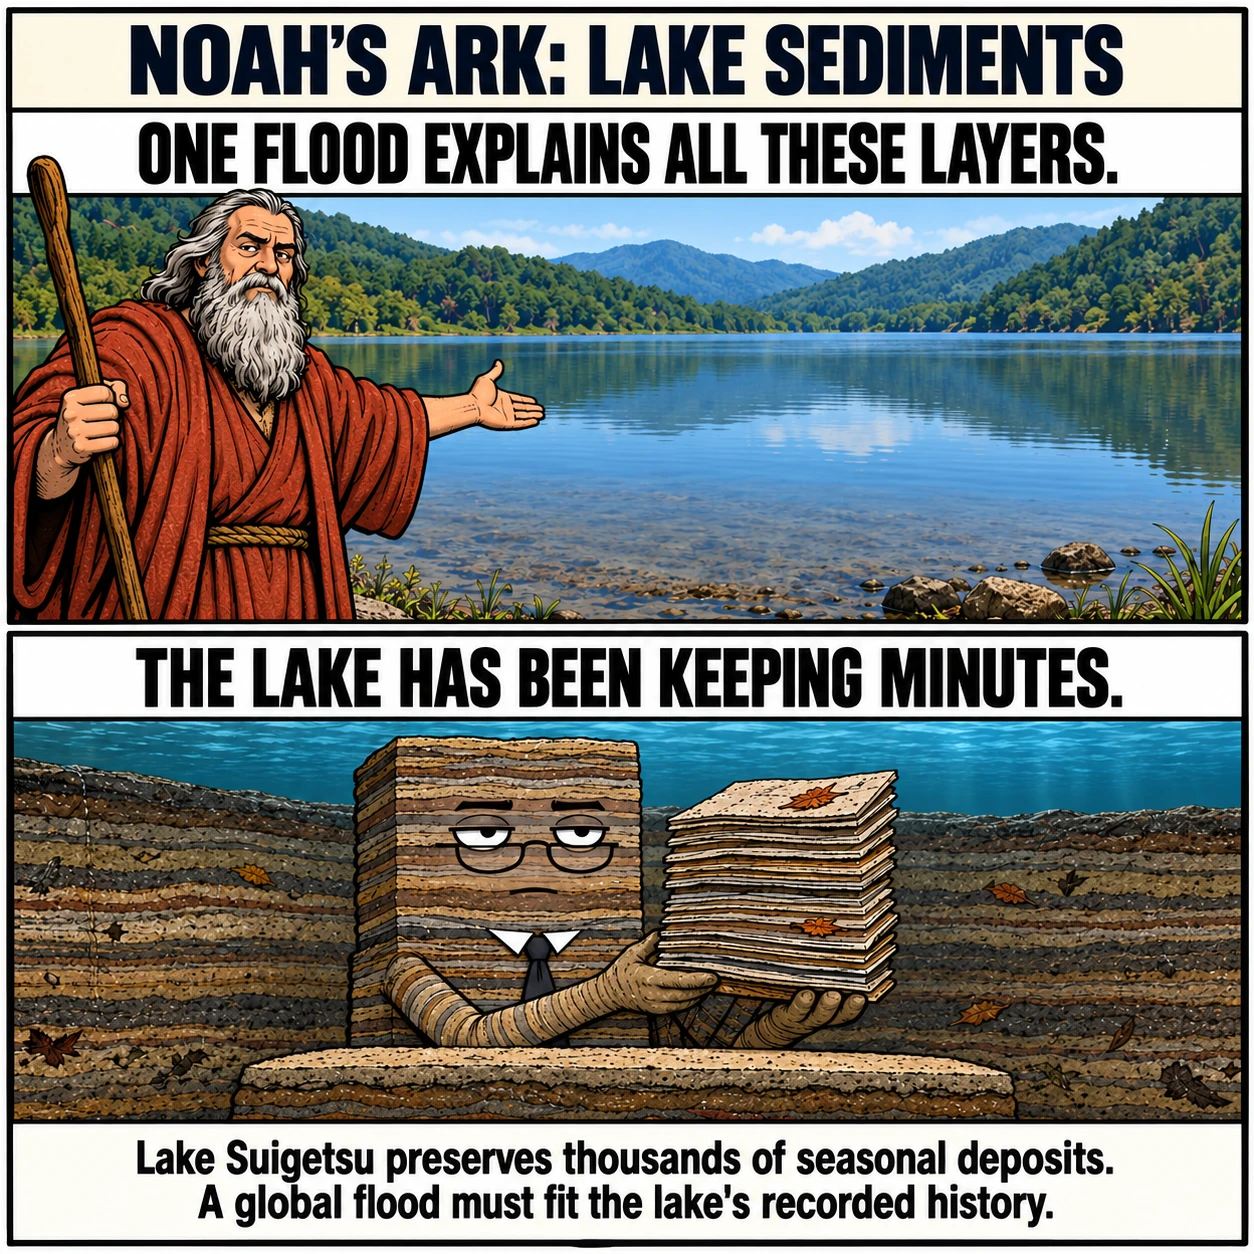
Some lakes accumulate recognizable seasonal sediment layers, called varves. Their chemistry, microscopic remains, and embedded plant material allow researchers to reconstruct how the lake and its surroundings changed.
Lake Suigetsu in Japan is especially useful. Multiple overlapping cores preserve a long sediment sequence, and plant remains from it helped establish a terrestrial radiocarbon record extending to about 52,800 years before present. Researchers distinguish seasonal deposits from exceptional sedimentation and account for uncertainties in matching and counting layers.
A global flood would change a lake's water chemistry, introduce material from outside its catchment, disturb its sediments, or replace its local biological community. The objection is not that every flood must erase every layer. It is that a world-drowning event must fit the actual sequence of lake conditions, including the Holocene record, rather than being inserted wherever a dark layer appears.
Ordinary local disturbances exist in such records. They do not add up to a synchronized global ocean covering the land.
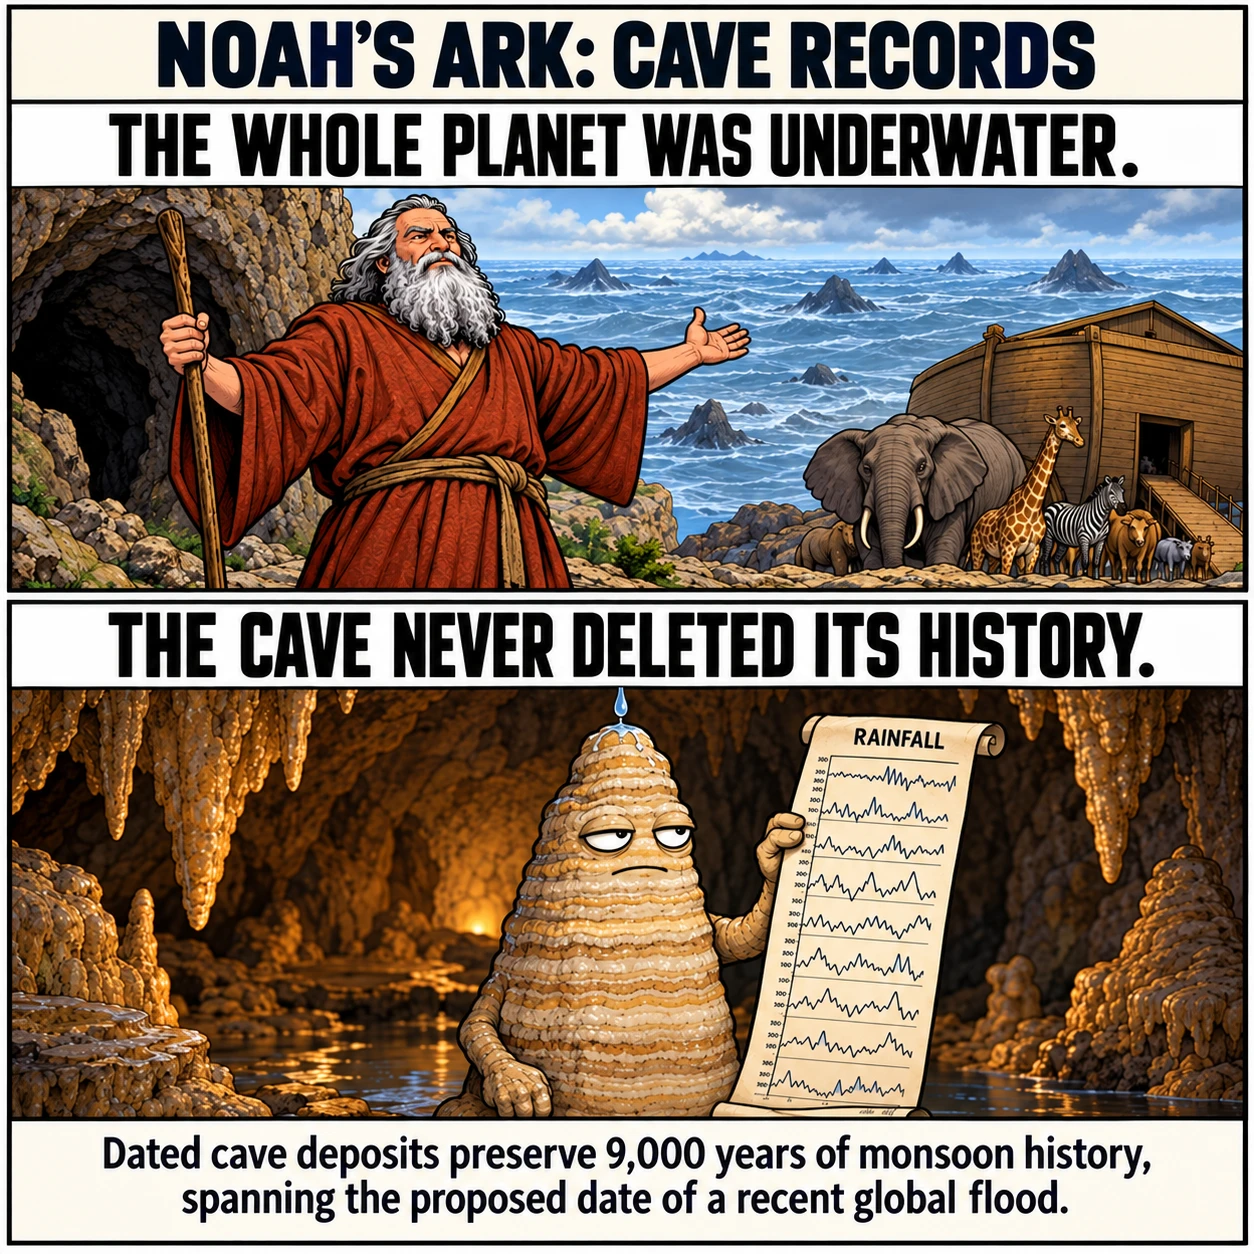
5. Cave deposits preserve rainfall histories across the relevant millennia
Stalagmites grow as mineral-bearing dripwater deposits calcite in caves. Researchers date suitable samples with uranium-thorium methods and measure changes in oxygen isotopes to reconstruct past rainfall and circulation.
A Dongge Cave study produced a continuous 9,000-year Asian monsoon history at approximately five-year resolution. A separate Chinese cave compilation extends much farther, to about 640,000 years. The recent record matters most here because it crosses the period proposed for Noah's flood.
A cave can flood locally and later resume growth. A stalagmite's mere existence is therefore not proof that its cave was never flooded. The stronger objection is the agreement between dated cave growth, changing rainfall, and other regional climate records. A global inundation must explain those sequences together, including why they preserve terrestrial climate histories instead of evidence for the same worldwide submergence.
Moving the flood date a few centuries does not remove it from a record spanning millennia.
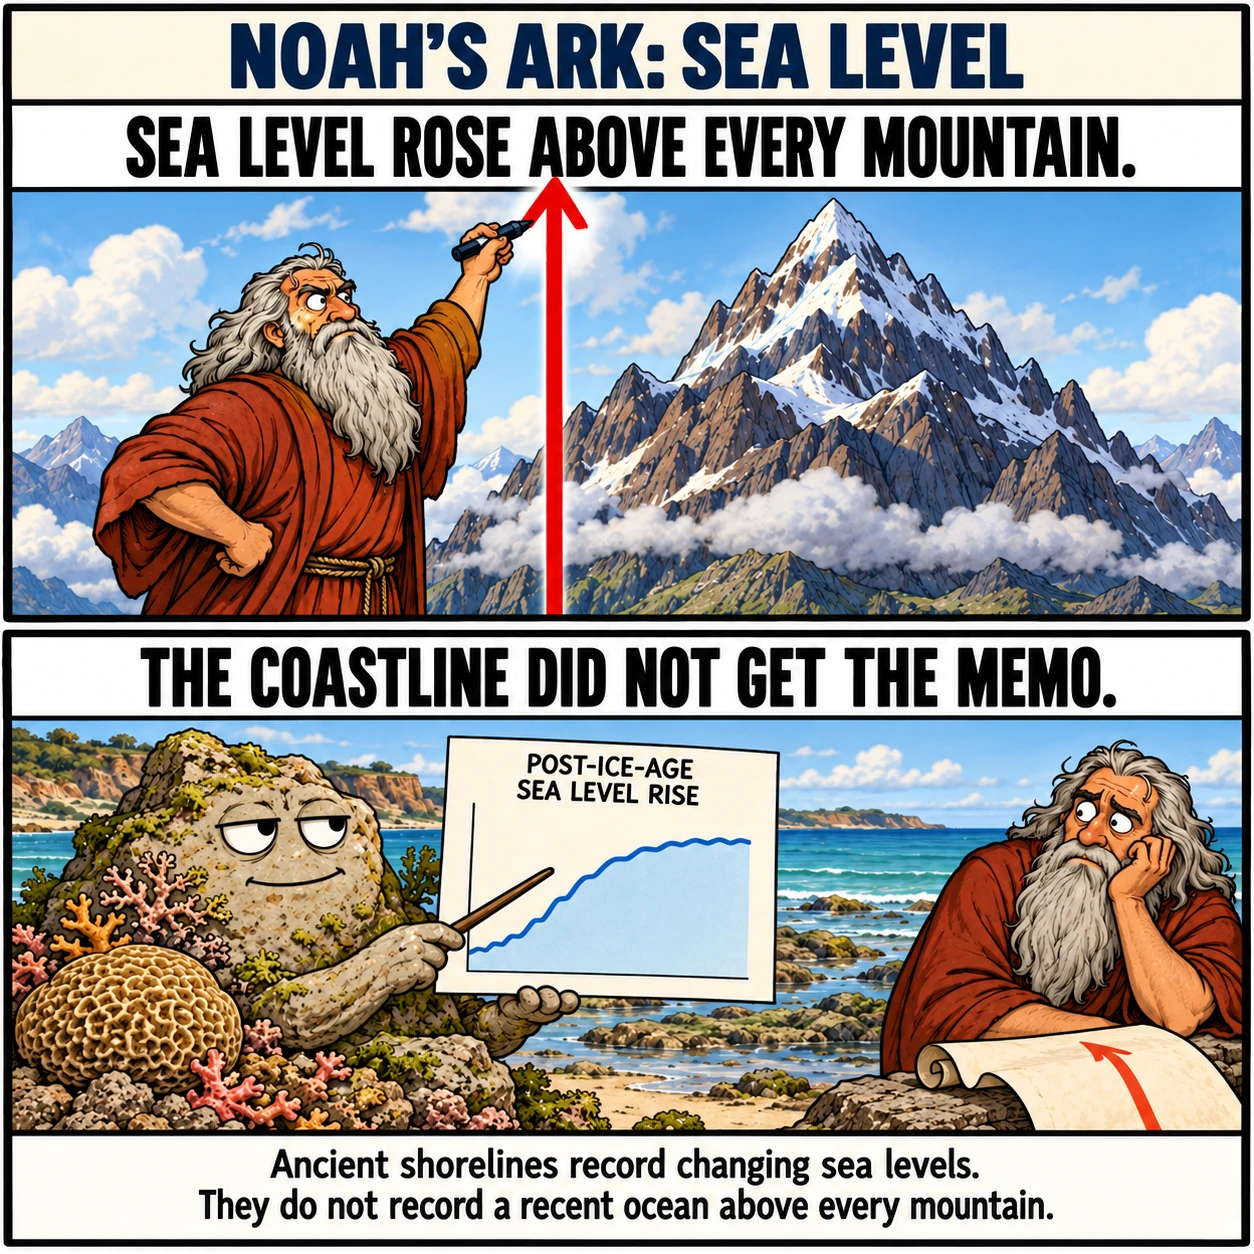
6. Ancient shorelines do not record mountain-high seas
Sea-level reconstruction uses dated evidence such as corals and coastal deposits, while accounting for land rising or sinking. Different places do not have identical local sea-level histories, so researchers distinguish local changes from changes in global ocean volume.
Lambeck and colleagues reconstructed sea level and ice volume from the last glacial maximum through the Holocene. Their results show a large rise as ice sheets melted, followed by a slowing rise through the more recent millennia. They do not show the oceans rising thousands of metres above today's level and then returning within a year.
The record does not resolve every brief wave at every coast. That limitation cannot hide the much larger proposition at issue. A prolonged flood reaching every mountain would affect coastlines, inland deposits, and marine ecosystems on an extraordinary scale. Its disappearance would also need explaining.
The observed changes fit the transfer of water between ice sheets and oceans. They contradict a recent episode in which all continents lay under deep water.
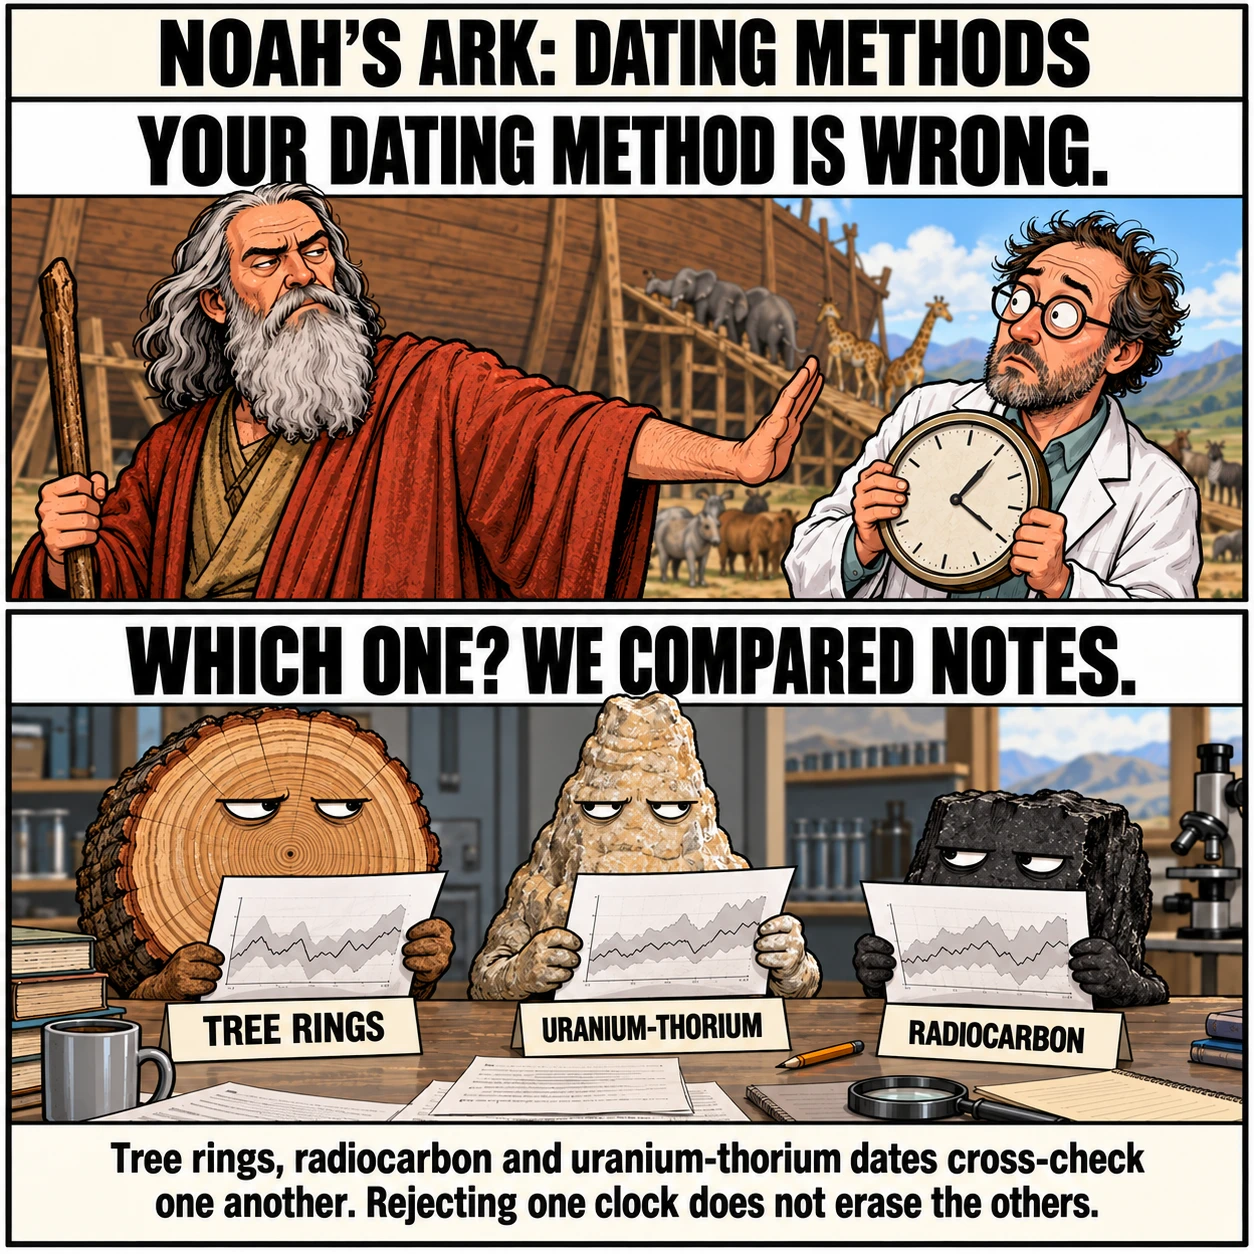
A common response to ancient environmental records is that the dates are all wrong. But the dates do not all come from one clock. Tree rings count growing seasons. Uranium-thorium dating measures radioactive change in suitable carbonate deposits. Radiocarbon measures a different isotope system in once-living material.
IntCal20, a major radiocarbon calibration curve, combines evidence from dated trees and other archives to account for changes in atmospheric carbon-14. It does not assume that atmospheric radiocarbon has always been constant. Corrections for changing carbon levels are a central part of the work.
These methods are not completely independent after researchers use them for calibration and alignment. That dependence should be acknowledged. Nevertheless, their underlying measurements differ, and their agreements impose real constraints. Claiming that flood conditions altered carbon-14 does not explain matching tree-ring sequences or uranium-thorium ages.
A replacement chronology must reproduce those cross-checks quantitatively. Simply calling all scientific dates unreliable leaves the flood claim without a chronology that fits the evidence.
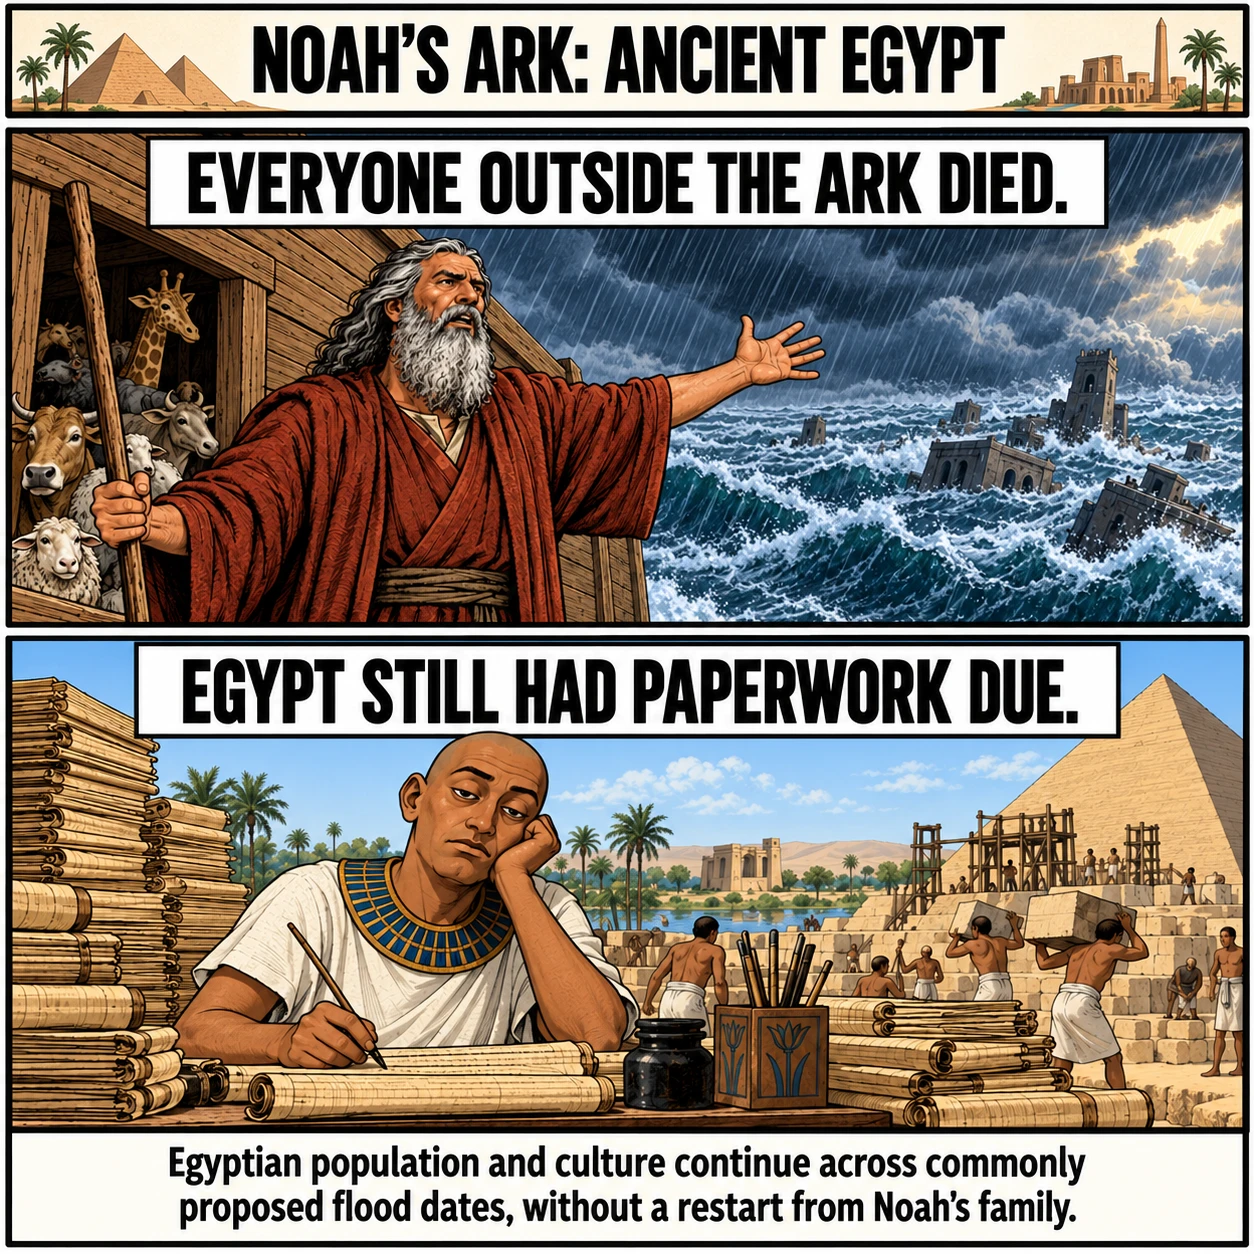
8. Egypt did not lose its entire population in the middle of the Old Kingdom
Egypt's Old Kingdom occupies much of the third millennium BCE, overlapping the familiar 2348 BCE flood date. Its monuments belong to a broader record of settlements, burials, administration, royal succession, and changing artistic practices.
The argument does not depend on a pyramid being too strong to wash away. A stone building might survive a flood. The problem is the continuation of an Egyptian society with its own population, institutions, and material traditions across the period when everyone outside Noah's family supposedly died.
Radiocarbon research also tests Egyptian chronology using short-lived plant remains associated with known historical contexts. Exact reign dates remain subjects of research, but uncertainty of years or decades does not supply evidence for total depopulation and recolonization by one family.
This objection directly challenges flood dates that overlap the Egyptian record. Placing the flood much earlier avoids that particular overlap, but then the longer environmental and genetic records remain to be explained.
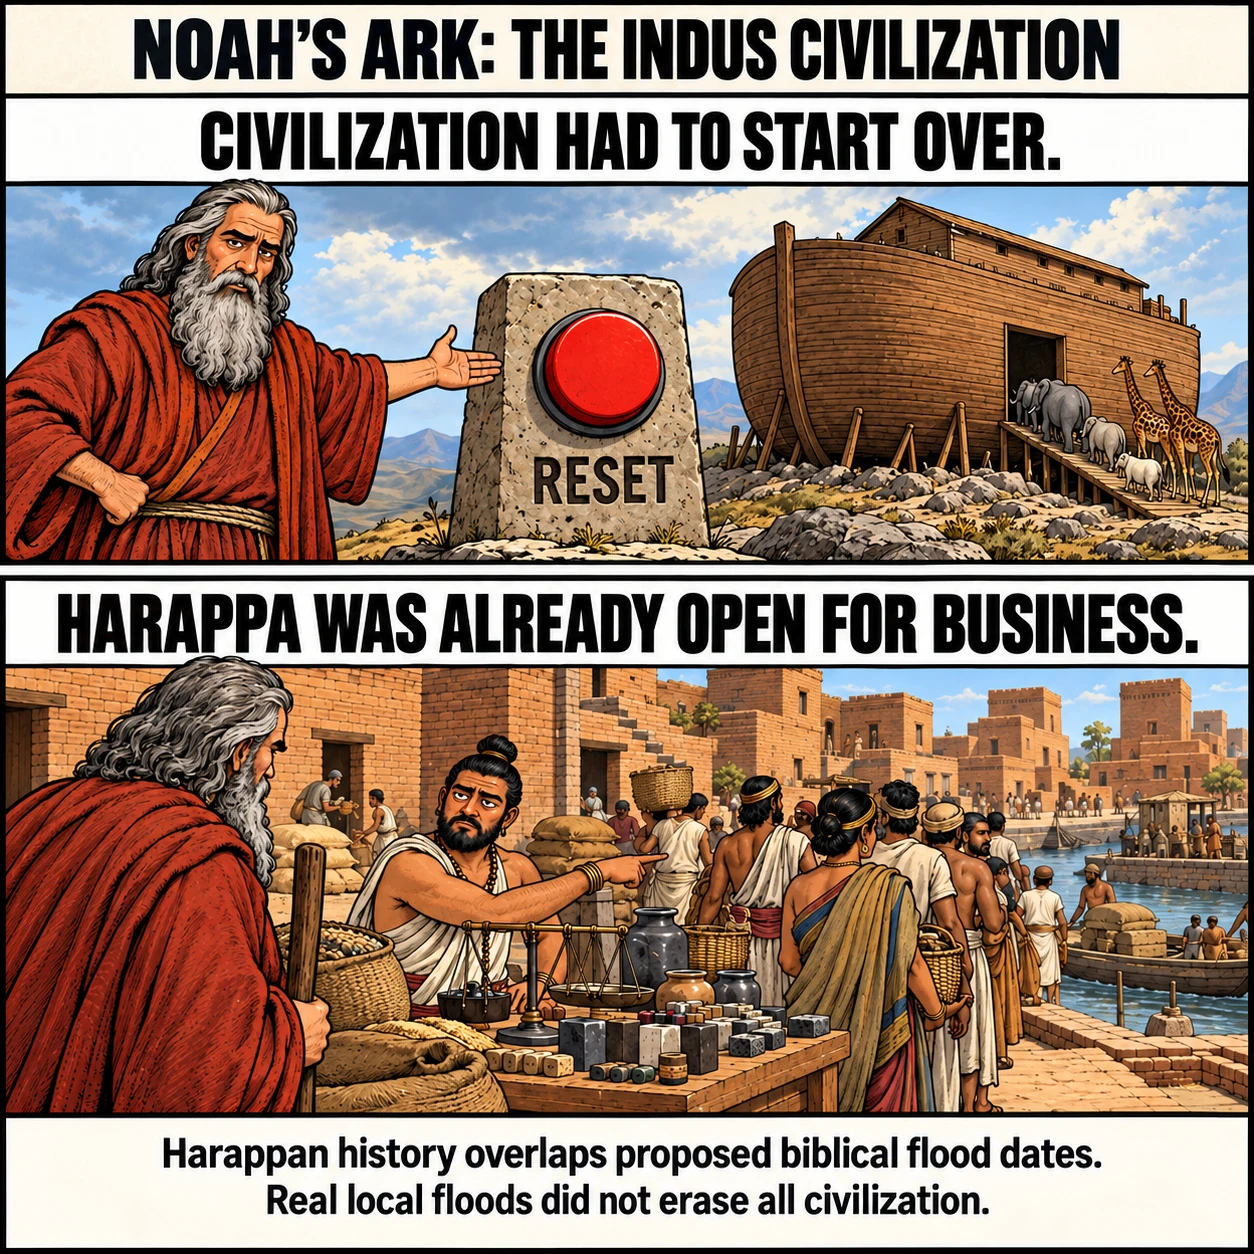
9. The Indus civilization continued through the same period
South Asia provides a geographically separate archaeological check. Excavations at Harappa document early occupation, developing urbanism, and the mature Harappan phase, conventionally dated about 2600 to 1900 BCE.
That is a long-lived regional history of buildings, crafts, trade, and settlement changes. It overlaps third-millennium dates proposed for a global flood. The evidence does not show the entire population disappearing together with Egypt's, followed by a new civilization descended from the same eight survivors.
Local floods and shifts in river courses mattered greatly to Indus settlements. Researchers investigate them through sediment cores, dating, and the geography of former rivers. Their existence cannot be promoted into a global catastrophe without evidence connecting the events in time and mechanism.
The practical test is whether the universal-flood account explains this region's archaeological sequence. It does not. Flood geology replaces a documented, regionally specific history with a worldwide reset that the excavated record does not display.
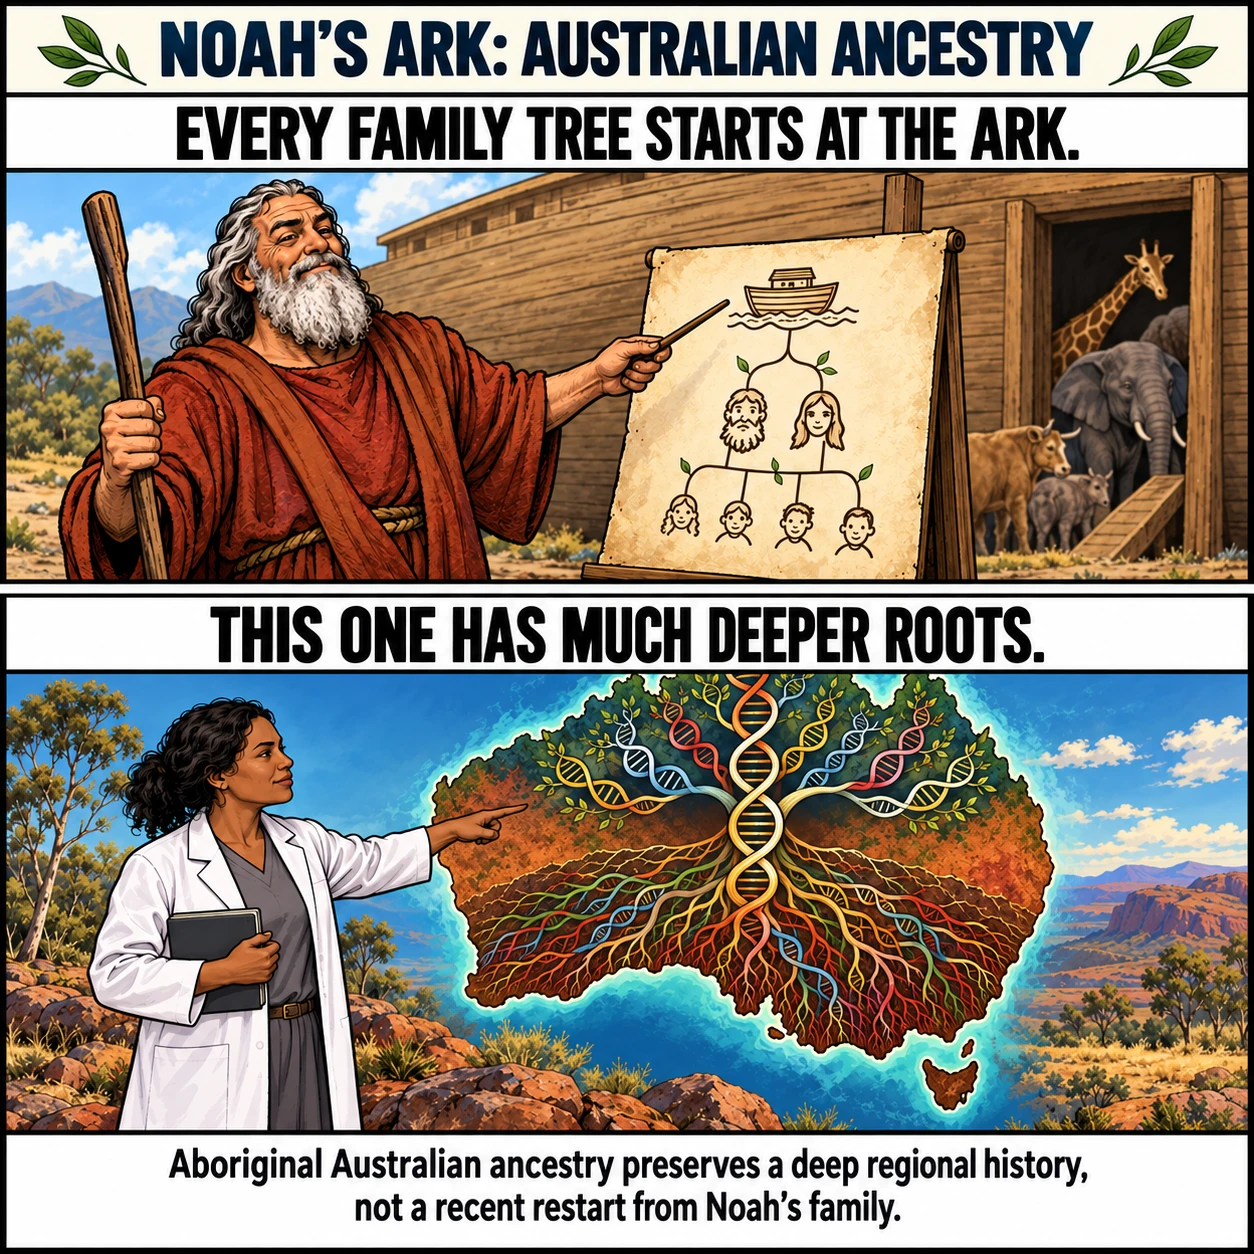
10. Aboriginal Australian ancestry was not replaced by a recent migration from the ark
Genomic research reconstructs a deep history for Aboriginal Australians and Papuans. A 2016 study found population diversification within ancient Sahul tens of thousands of years ago. A separate mitochondrial study identified long-standing regional ancestry within Australia.
Those findings are incompatible with everyone in Australia dying a few thousand years ago and the continent then being repopulated entirely by descendants of a family arriving from western Asia. Such a replacement would produce a radically different recent ancestry pattern.
This is stronger than pointing to one very old stone tool. An old object could, in principle, survive a later catastrophe. The crucial evidence connects living populations to a deep, geographically structured history. The dates and details of early settlement can be debated without reducing that history to a recent ark migration.
Genetics does not mean that cultures or populations remained unchanged or isolated forever. It shows that their ancestry cannot be explained by the global replacement required by the literal story.
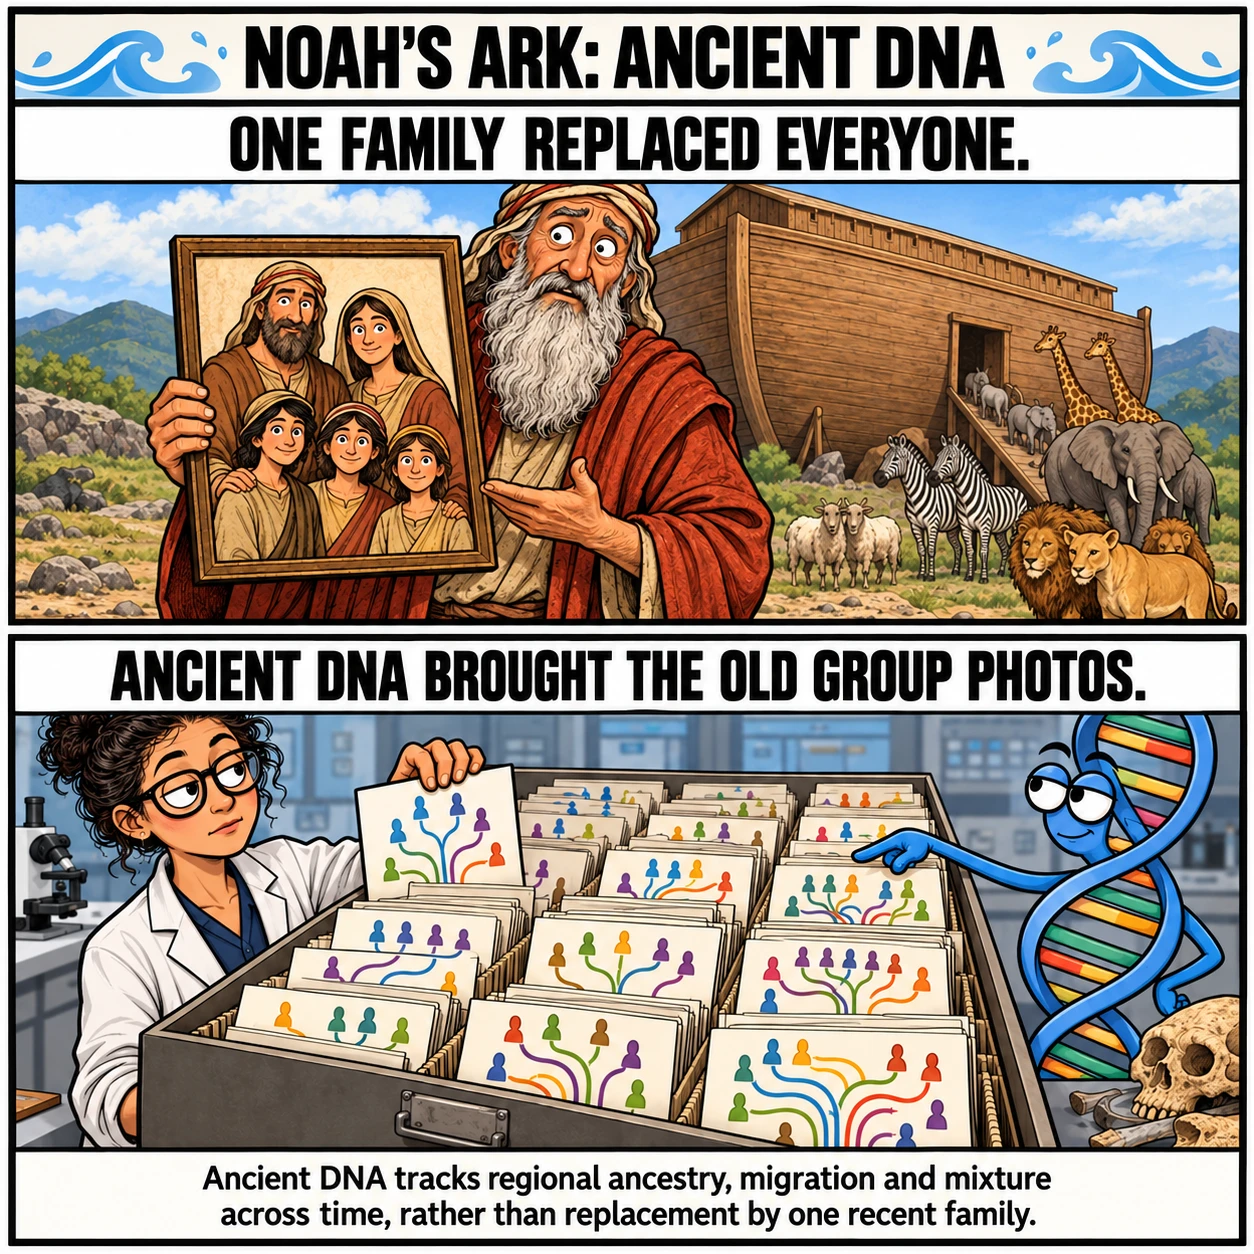
11. Ancient DNA records multiple populations through the supposed reset
Ancient DNA allows researchers to sample past people directly rather than infer everything from living populations. Work on the Southern Arc, including Anatolia and neighbouring regions, analysed 727 ancient individuals across roughly 10,000 years.
The results reveal changing mixtures of ancestry, regional persistence, and migration. That is a complicated human history in and around the broad region associated with the ark's landing. It does not resemble all humanity being reduced to one household and spreading outward after a recent global flood.
No ancient-DNA project samples every village or every generation. The inference comes from patterns across many individuals and periods, combined with archaeology. A global-replacement model must reproduce those patterns and the histories of populations elsewhere.
Ancient DNA is especially damaging to attempts to treat every pre-flood population as unrelated to later people. Researchers can track ancestry across time. They find population changes of many kinds, but the worldwide extinction-and-restart required by the story is absent.
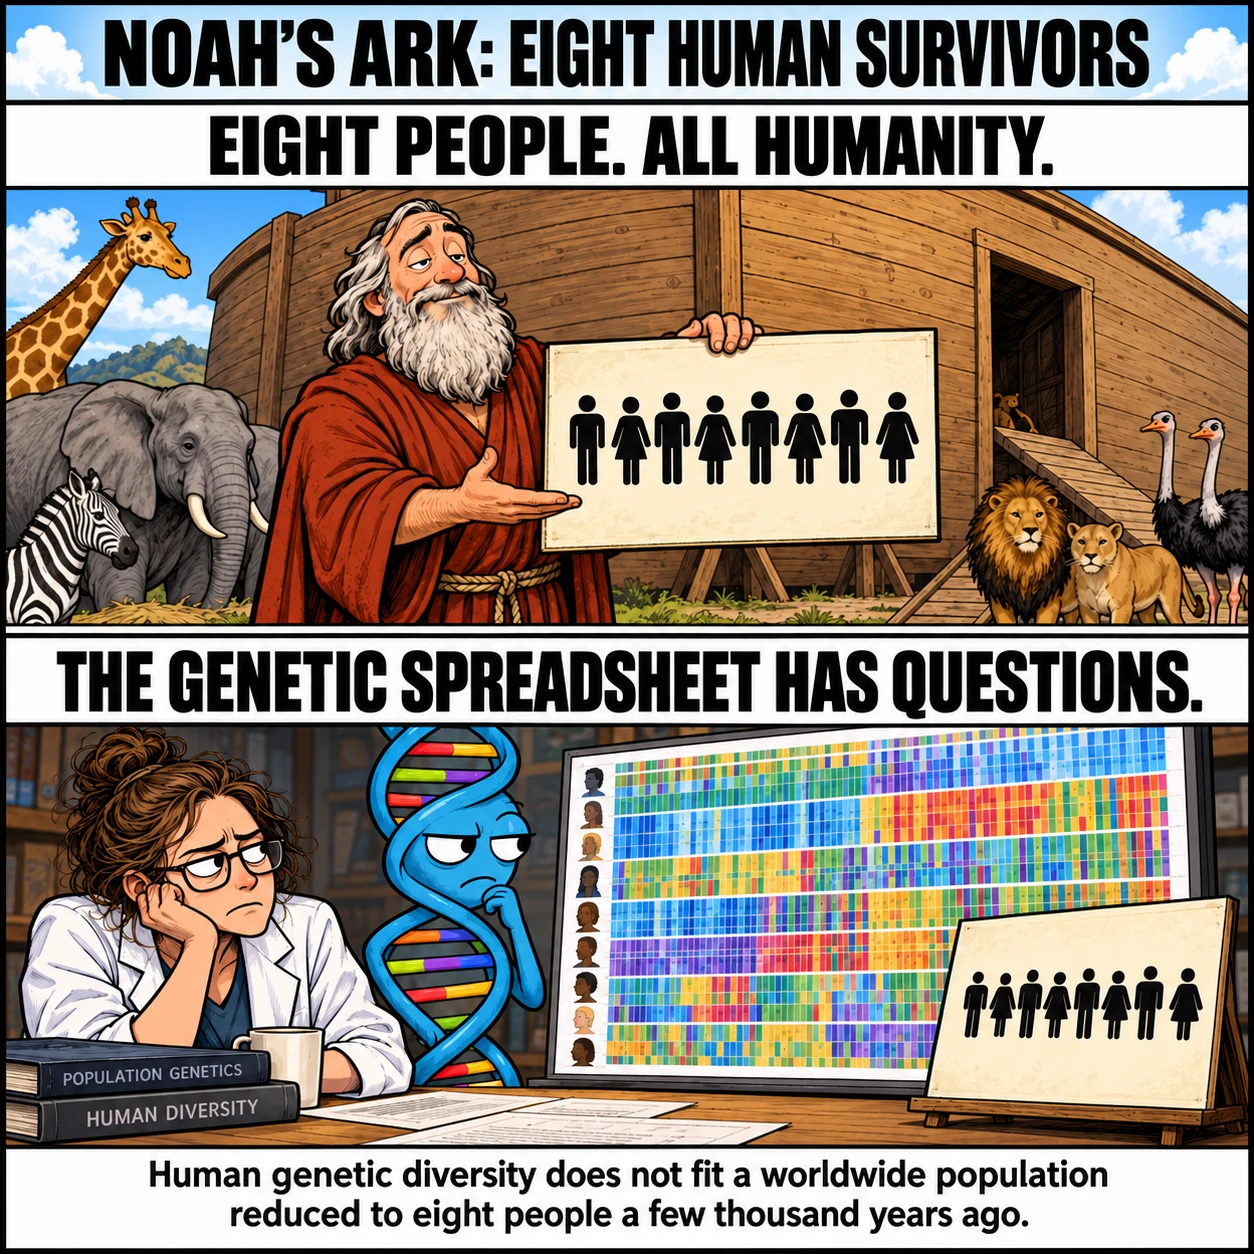
12. Human genetic diversity does not fit a recent eight-person bottleneck
A population bottleneck is a severe reduction in the number of reproducing individuals. It changes which genetic variants survive and how stretches of DNA are shared among descendants. In the ark story, the eight survivors also include close relatives, further limiting independent ancestry.
Research using multiple human genomes reconstructs population separations, changes in population size, and exchanges of ancestry. Schiffels and Durbin's work reaches into the last few thousand years and finds different histories in different regions, rather than a single recent global collapse to one family.
These estimates are models, not literal census counts. Their resolution varies, and inferred effective population size is not the same thing as the number of people alive. A single smooth curve cannot rule out every short bottleneck by itself.
The stronger case uses the combined distribution of variation, ancient genomes, and regional ancestry. A recent eight-person origin for all living humans fails to account for that evidence under measured mutation and inheritance processes.
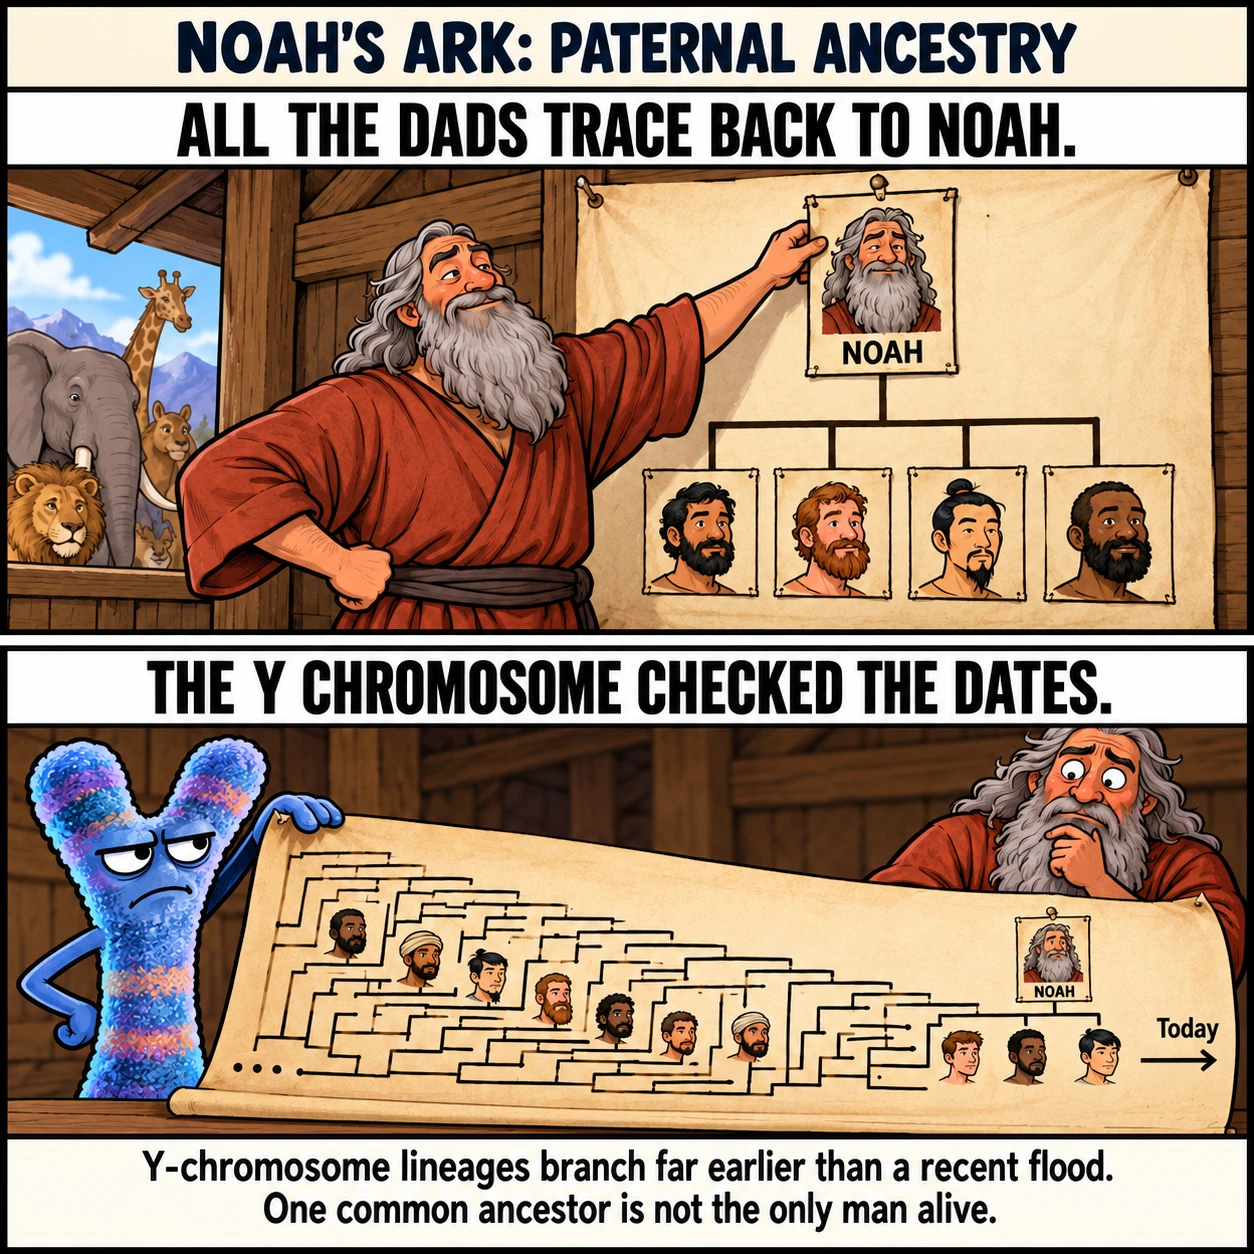
13. Paternal lineages do not converge on a recent Noah
The Y chromosome supplies a more specific prediction. Under the usual reading of the story, Noah and his biological sons were the only surviving men. Their paternal lines therefore trace through Noah. The inherited, non-recombining portion of their Y chromosomes would be nearly identical, apart from recent mutations.
Today's Y-chromosome lineages contain much deeper branching. A study of 1,244 men from 26 populations reconstructed a worldwide paternal tree with branches extending far beyond the proposed flood date. The observed differences cannot accumulate in only a few thousand years at the rates used in genetic research.
This does not mean that the most recent common paternal ancestor was the only man alive in his time. That is a frequent misunderstanding of genetic ancestry. The point is narrower. If all surviving paternal lines really passed through one recent man, their common ancestor could not be older than him.
The ark genealogy makes precisely that testable claim, and the evidence contradicts it.
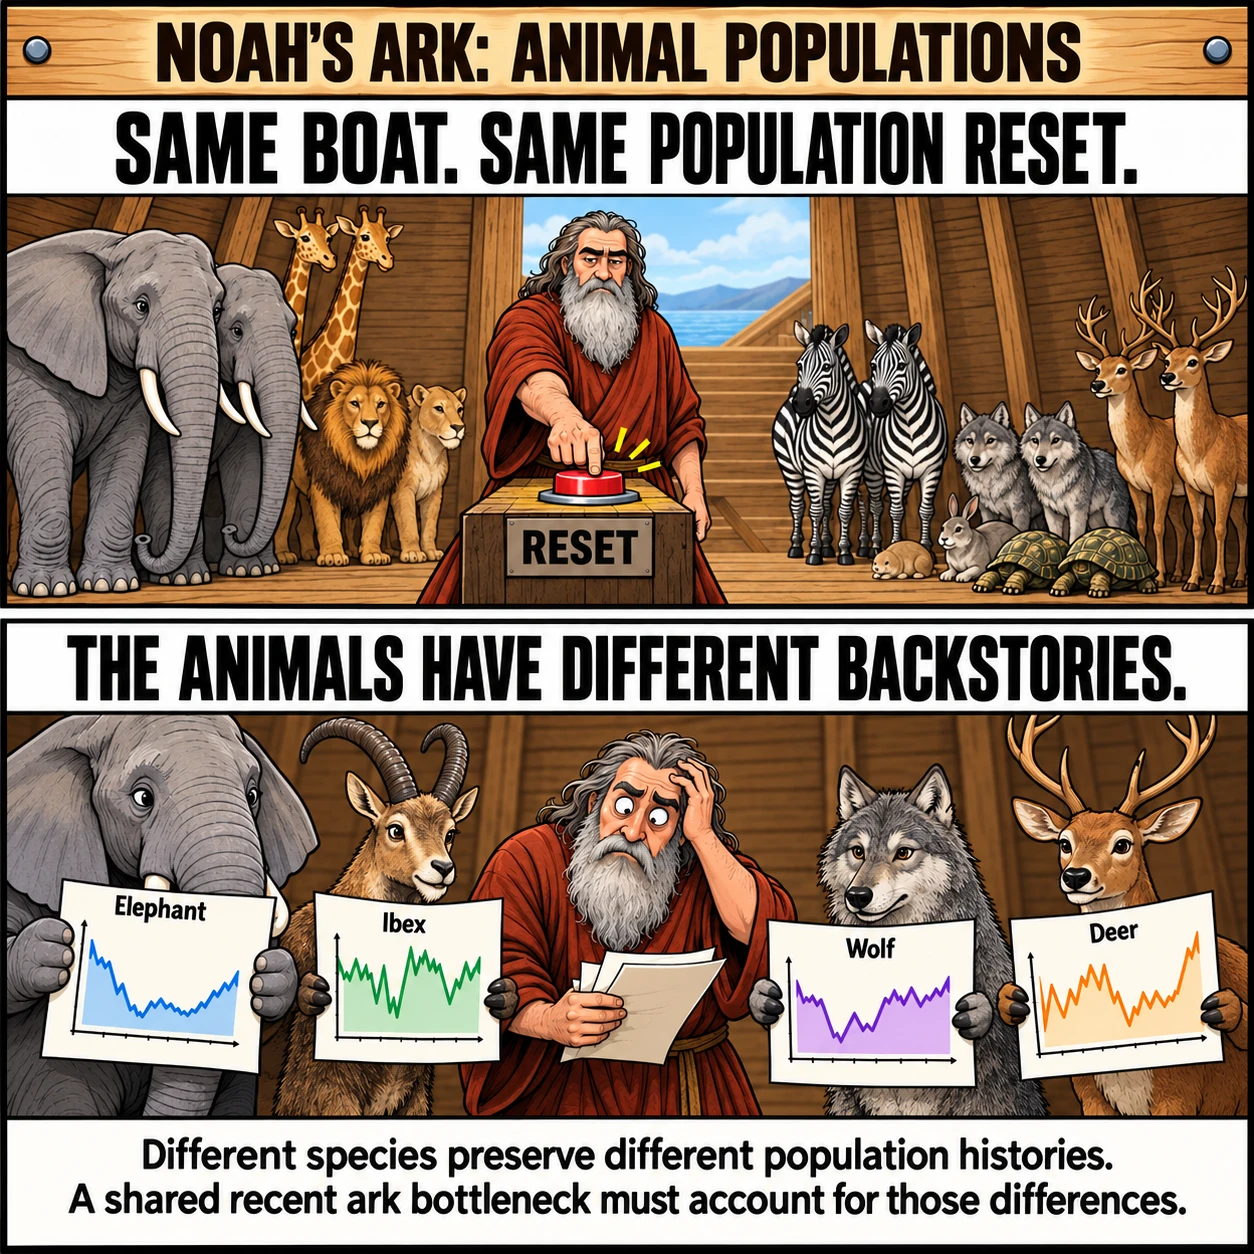
14. Animals do not share the ark's predicted population history
The ark account applies a related bottleneck to land animals. For groups represented by a single breeding pair, all later inherited variation must pass through those two individuals. Groups carried in larger numbers still undergo an extreme reduction.
Comparative genomic research instead finds different demographic histories among species and regions. A study of 139 living megafauna species reconstructed long population declines associated with different ecological and historical circumstances. It did not identify a universal ark event.
That study's deep-time method has limited power to resolve extremely recent, brief bottlenecks, so its curves alone are not a decisive test of one year in the third millennium BCE. The broader problem is the absence of a coherent genetic model in which all these species pass through the prescribed founders and subsequently acquire their observed variation.
Calling many species one original biblical "kind" changes the proposal. It then requires the extensive post-flood diversification discussed below, rather than solving the genetic problem automatically.
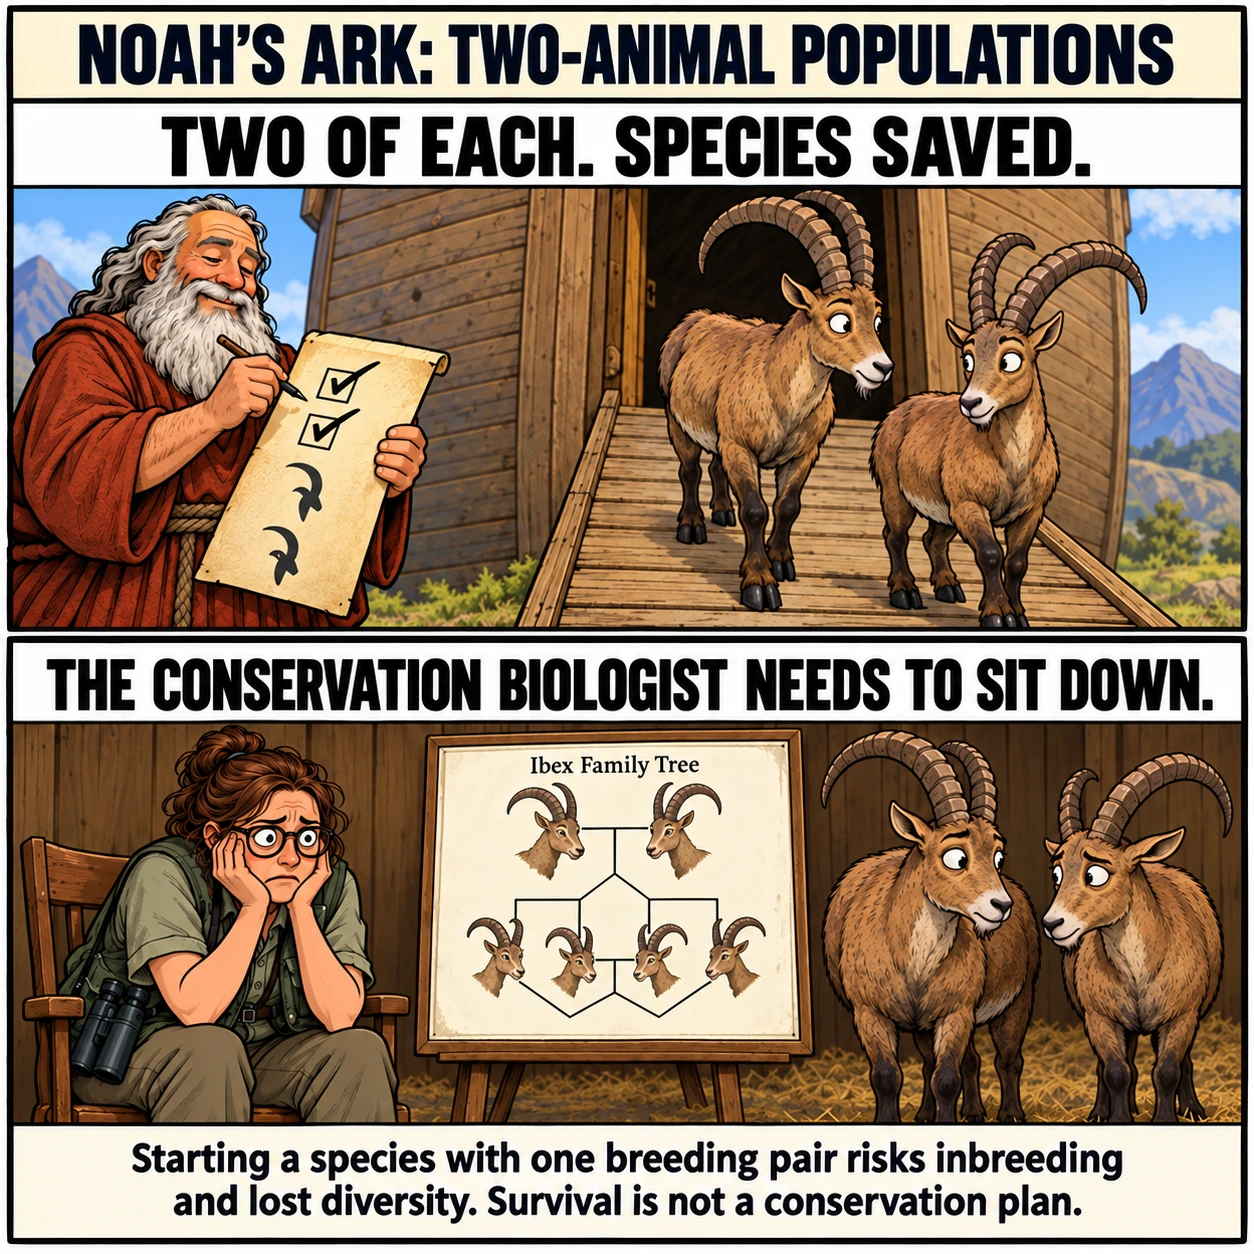
15. A breeding pair is a precarious foundation for a species
Two animals do not constitute a secure conservation population. Their descendants must breed with close relatives unless unrelated animals are available. That increases the chance that harmful recessive variants occur in matching copies and reduces the population's genetic options when conditions change.
Real bottlenecks show both damage and occasional recovery. Research on Alpine ibex found that bottleneck history predicts genome-wide variation and that severe bottlenecks can remove some highly harmful mutations. Such purging does not mean that every small population becomes healthy or regains the diversity it lost.
This objection should not be exaggerated into "two animals can never found a population." Sometimes very small founder populations survive. The ark claim requires survival and successful expansion across an enormous range of organisms simultaneously, after their habitats have also been devastated.
That combination creates a biological burden far beyond merely getting animals off a boat. It weakens the proposed recovery mechanism; it is not, by itself, a mathematical proof of inevitable extinction for every species.
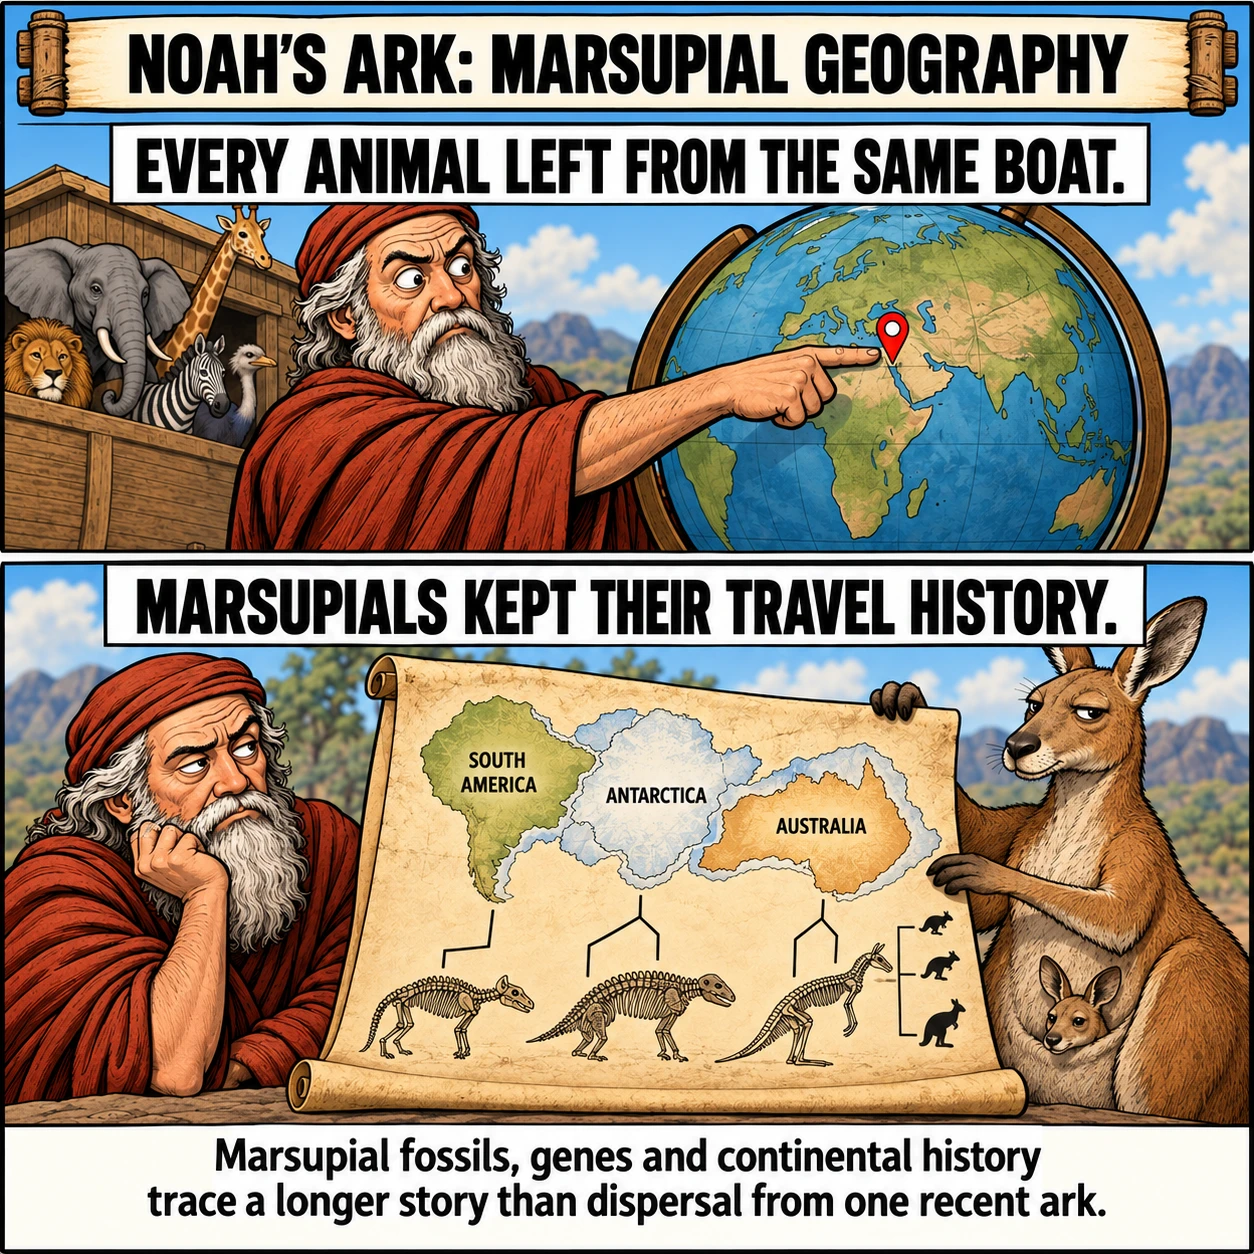
16. Marsupial geography follows ancient continental history
Australian marsupials are part of a branching evolutionary history connected to South America and Antarctica. Genetic evidence, including inherited insertions in the genome, helps reconstruct relationships among the major marsupial groups. These relationships make sense in the context of ancient southern continents and their changing connections.
A recent release from an ark in western Asia proposes a very different history. It requires the ancestors of Australia's distinctive mammals to reach Australia, establish populations there, and leave a pattern of relationships that resembles a much older continental history.
The simplistic objection is "kangaroos could not swim that far." The stronger objection concerns the whole distribution of relatives, fossils, and genetic branches. Explaining one animal's hypothetical journey does not explain the pattern.
Natural dispersal, including occasional rafting, is real. The question is whether dispersal evidence supports a recent common departure point for all terrestrial fauna. Marsupial relationships instead support a long regional history, with details still being refined by new fossils and genomes.
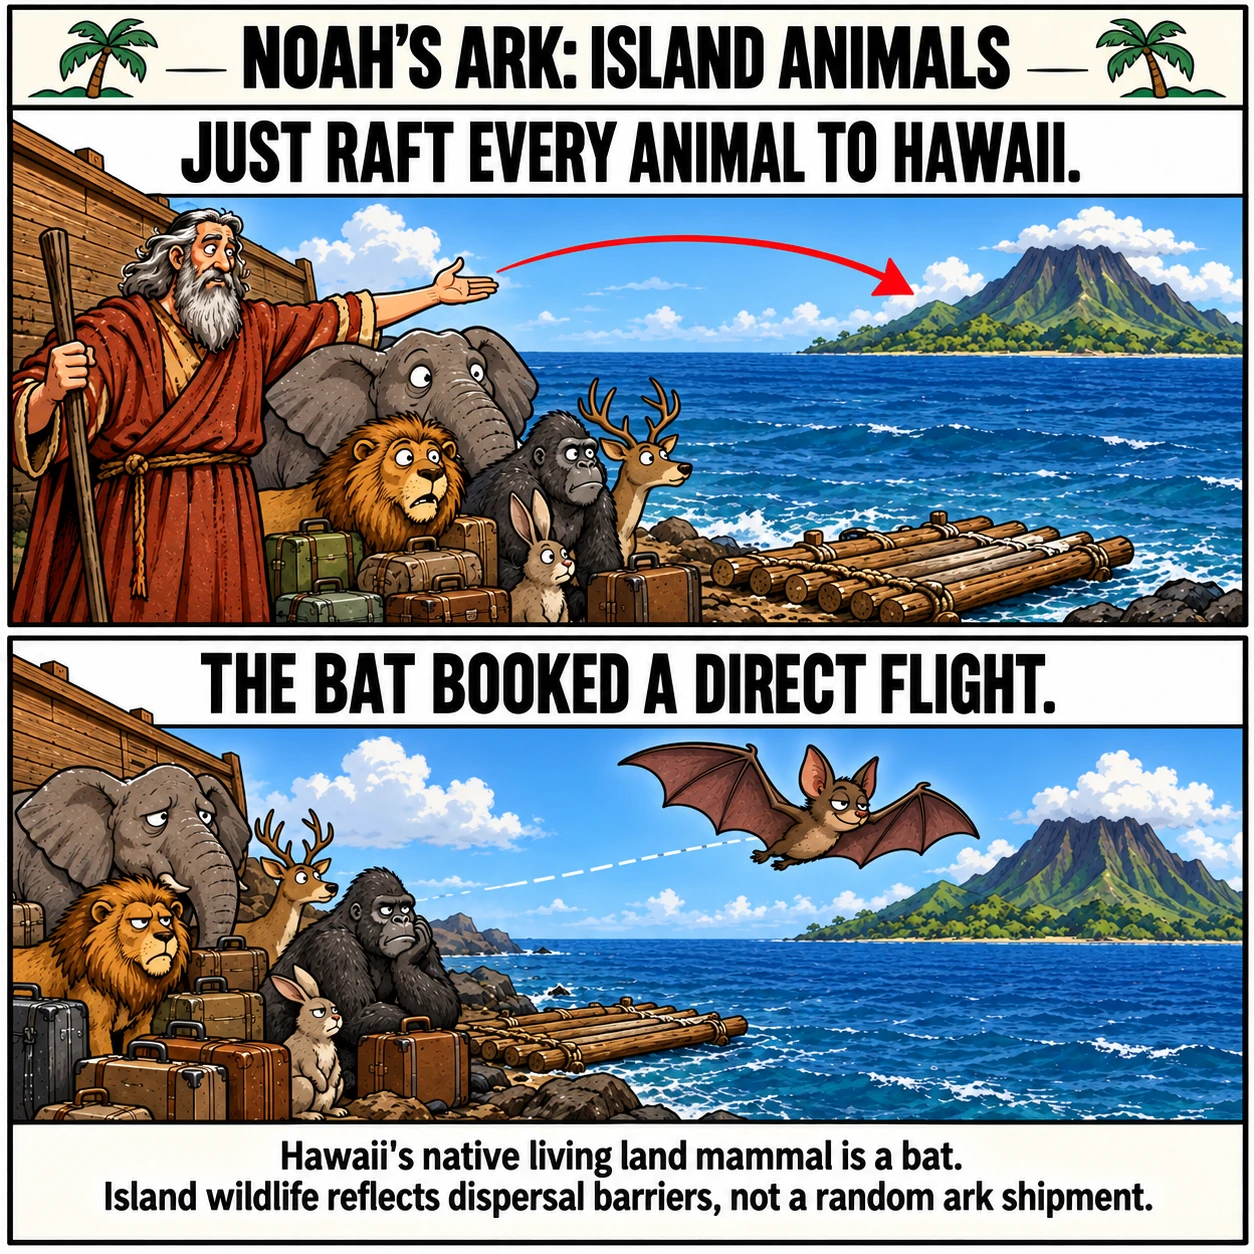
Hawaii's native mammals illustrate a broader biogeographic pattern. Its living native land mammal is a bat; its native marine mammals can reach the islands through the ocean. Many other mammals arrived with humans.
This distribution makes sense when colonization depends on crossing water. Flying animals and marine travellers have opportunities unavailable to most land mammals. Island communities reflect those filters, subsequent evolution, and extinction.
A global flood followed by universal dispersal from one ark must explain why the resulting communities so consistently reflect geographical barriers and different capacities for travel. Invoking rafts whenever an organism needs transport does not explain why some groups repeatedly arrive and others fail to do so.
Island geography alone does not logically exclude an ark. It supplies a comparative test that ordinary colonization explains well, while a recent universal redistribution adds assumptions without improving the explanation. The evidence concerns entire communities, not whether one lucky animal might survive a long voyage.
18. Freshwater animals retain histories of separate lakes and rivers
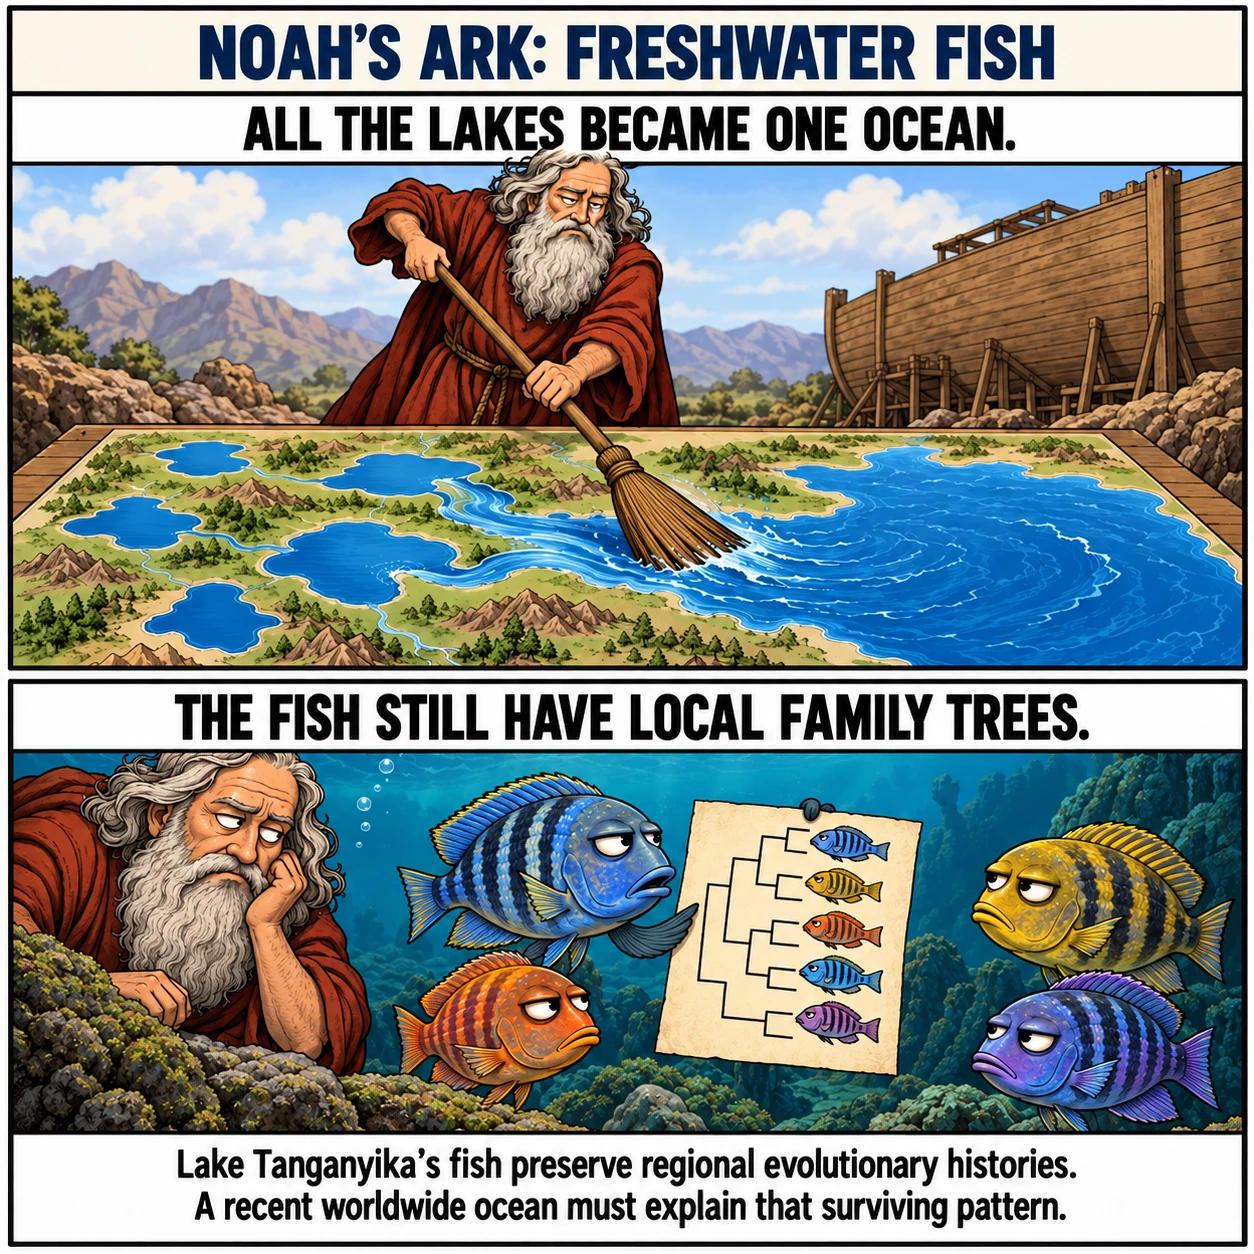
Freshwater organisms often have distributions tied to particular drainage basins. Lake Tanganyika's cichlids are a striking example of regional diversification, with many species restricted to that lake. Genomic research reconstructs their relationships and the history of their expansion into different ecological roles.
A deep global flood would connect and radically alter freshwater environments. Depending on the model, it would also expose their inhabitants to salt, suspended sediment, changed temperatures, and strong currents. The surviving fauna would then have to reassemble into geographically structured communities.
The difficulty is explaining both survival and the detailed pattern of ancestry afterward. A claim that fish simply stayed in their original lakes needs a physical account of how those habitats remained intact beneath the proposed ocean. A claim that they dispersed everywhere must explain their restricted distributions and older evolutionary relationships.
This argument combines biogeography with environmental constraints. It does not assume that freshwater species never move between basins or that every lake's history is undisturbed.
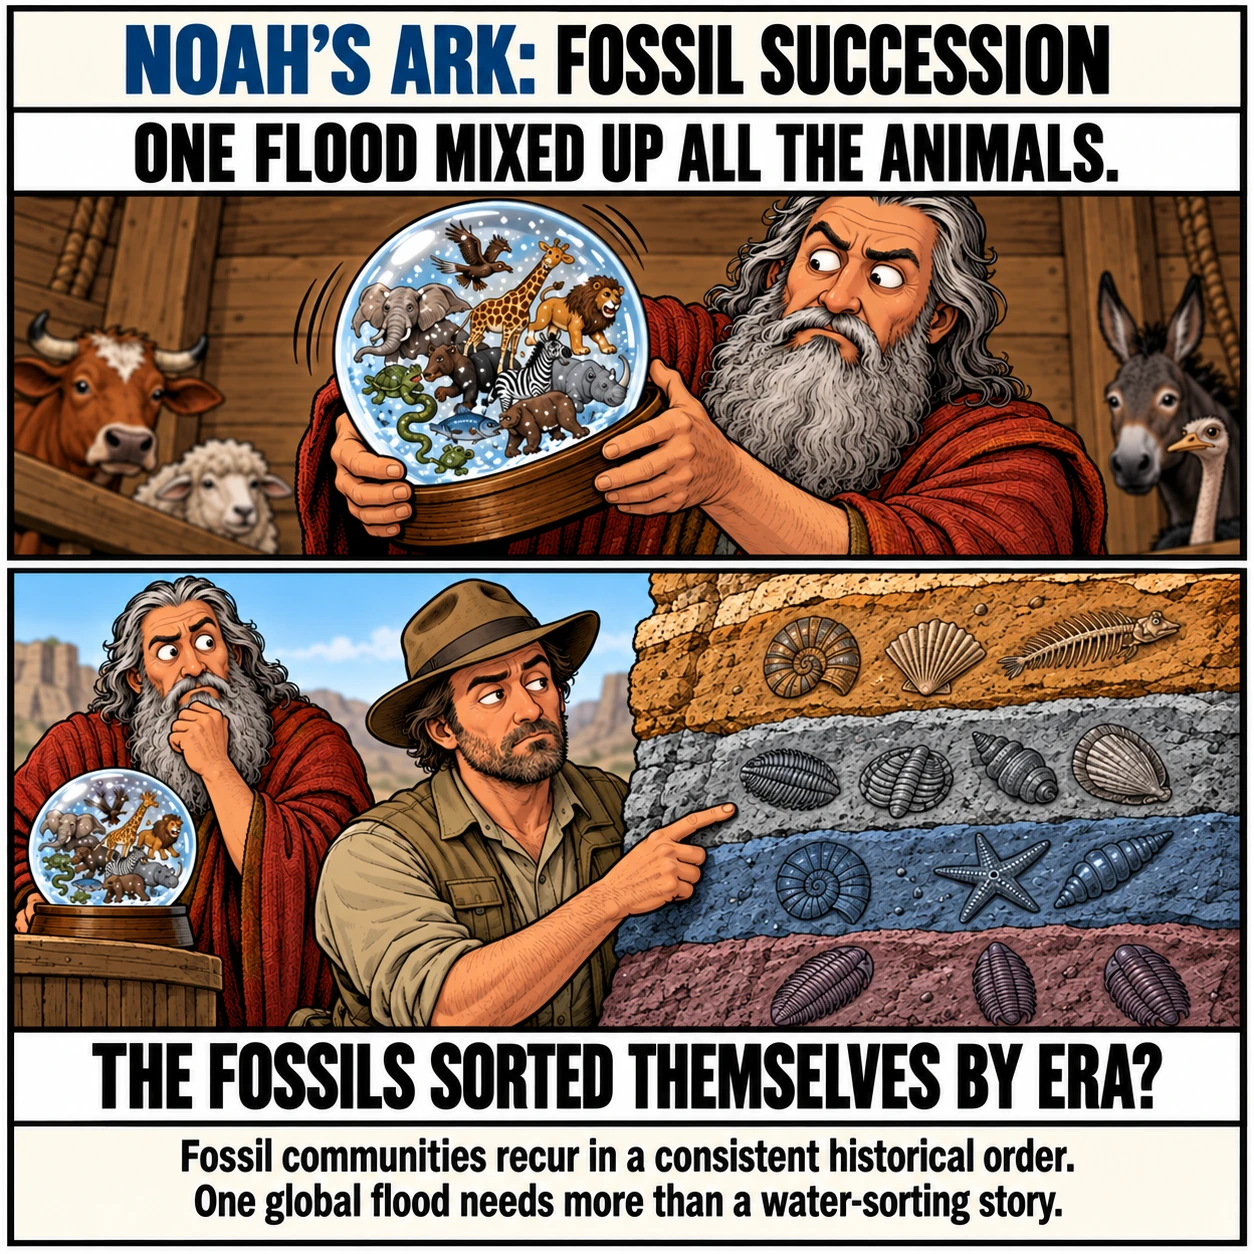
Fossils do not occur as a single worldwide mixture of everything alive at the time of Noah. Different rock intervals preserve different communities, and recognizably ordered successions recur across large areas. Geologists used these patterns to correlate rocks before modern radiometric dating existed.
Flood explanations sometimes appeal to sorting by body size, habitat, or ability to escape rising water. Water really can sort particles and remains. But that does not explain the full sequence, especially repeated changes among small marine organisms that occupied comparable environments.
The evidence is not that every species appears everywhere, or that older fossils can never be reworked into younger sediment. Preservation and reworking are studied parts of geology. The challenge is the consistent large-scale order, including appearances, disappearances, and changing communities.
That order contradicts the claim that most fossil-bearing strata formed during one recent inundation. It does not, by itself, exclude a later flood that deposited almost nothing. The recent environmental records test that separate proposal.
20. Volcanic layers give the fossil record a much longer timescale
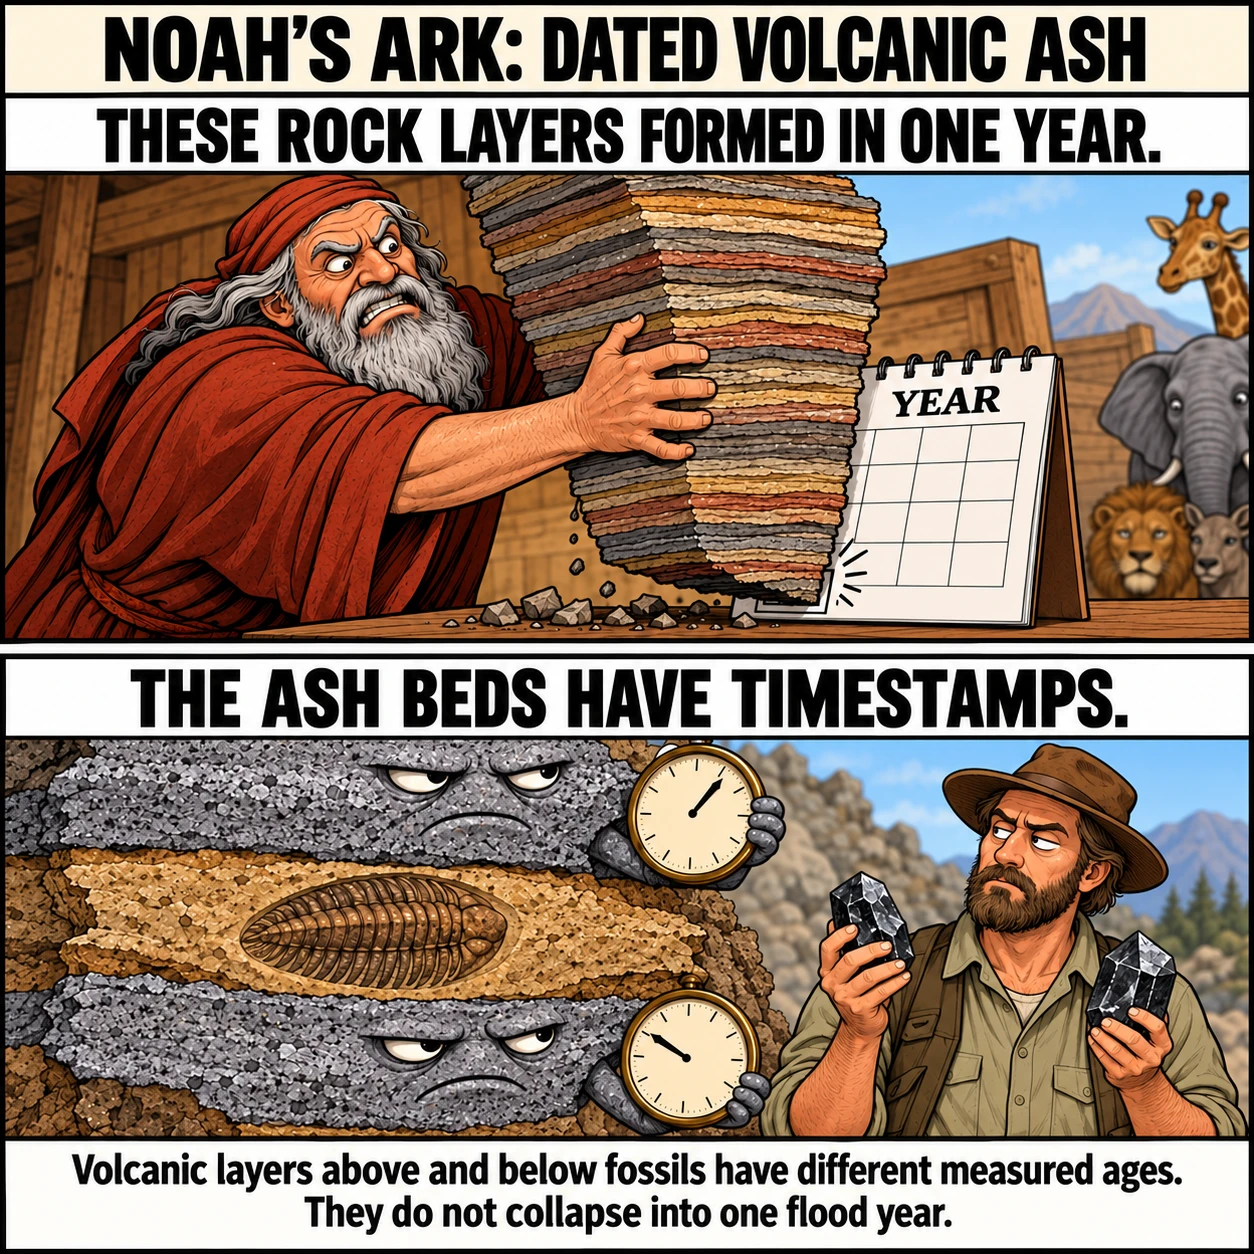
Radiometric dating can measure when suitable minerals in volcanic rocks formed. Where ash beds or lava occur among sedimentary layers, they help bracket the ages of the surrounding fossils and deposits.
This avoids a common misunderstanding. Geologists do not ordinarily date a sandstone's deposition by assuming every sand grain formed when the sandstone accumulated. Old grains can be eroded and redeposited. Researchers select the material and isotope system appropriate to the event they are trying to date.
Dated volcanic horizons show that fossil-bearing sequences accumulated across immense intervals, rather than within a single recent flood year. The agreement between geological relationships and suitable isotope measurements is the important result.
A rock's great age does not prove it could never have been flooded later. This method specifically disproves the assignment of widely separated rock-forming and fossil-burial events to Noah's flood. Any flood model that reclassifies those rocks as pre-flood must stop using them as evidence that the flood deposited the geological record.
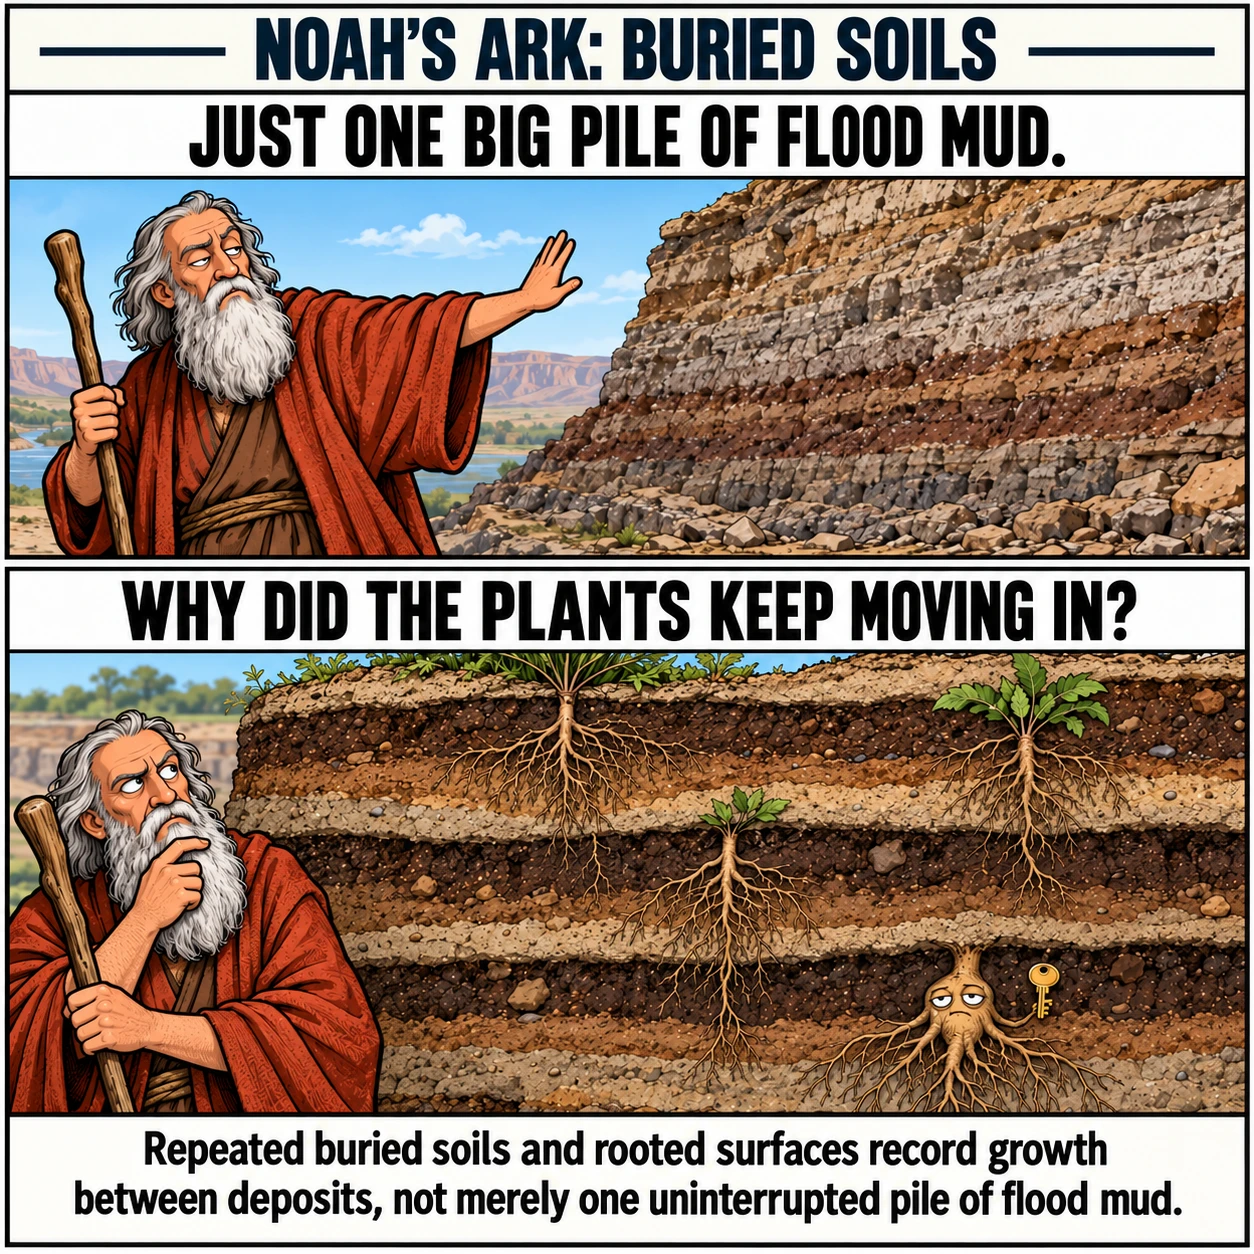
21. Buried soils record land surfaces between deposits
Ancient soils, called paleosols, preserve evidence that a sediment surface supported soil-forming processes before another deposit buried it. Rooting, chemical changes, and soil structure help distinguish them from a simple pile of water-laid mud.
The Chinle Formation at Petrified Forest National Park includes deposits shaped by floodplains, changing water tables, and ancient soils. Its colours and mineral chemistry record different conditions within those environments.
A flood can bury an existing soil. That explains one boundary. Repeated developed soils within a thick sequence require repeated intervals when plants and soil processes operated on exposed or shallowly waterlogged land. They cannot all represent uninterrupted deposition beneath a deep global ocean.
Soil formation has no single universal rate, and some changes happen quickly. The argument rests on the whole sequence of formation, occupation by roots, burial, and renewed soil development. Calling every layer flood sediment ignores the evidence that some layers were functioning land surfaces before the next ones arrived.
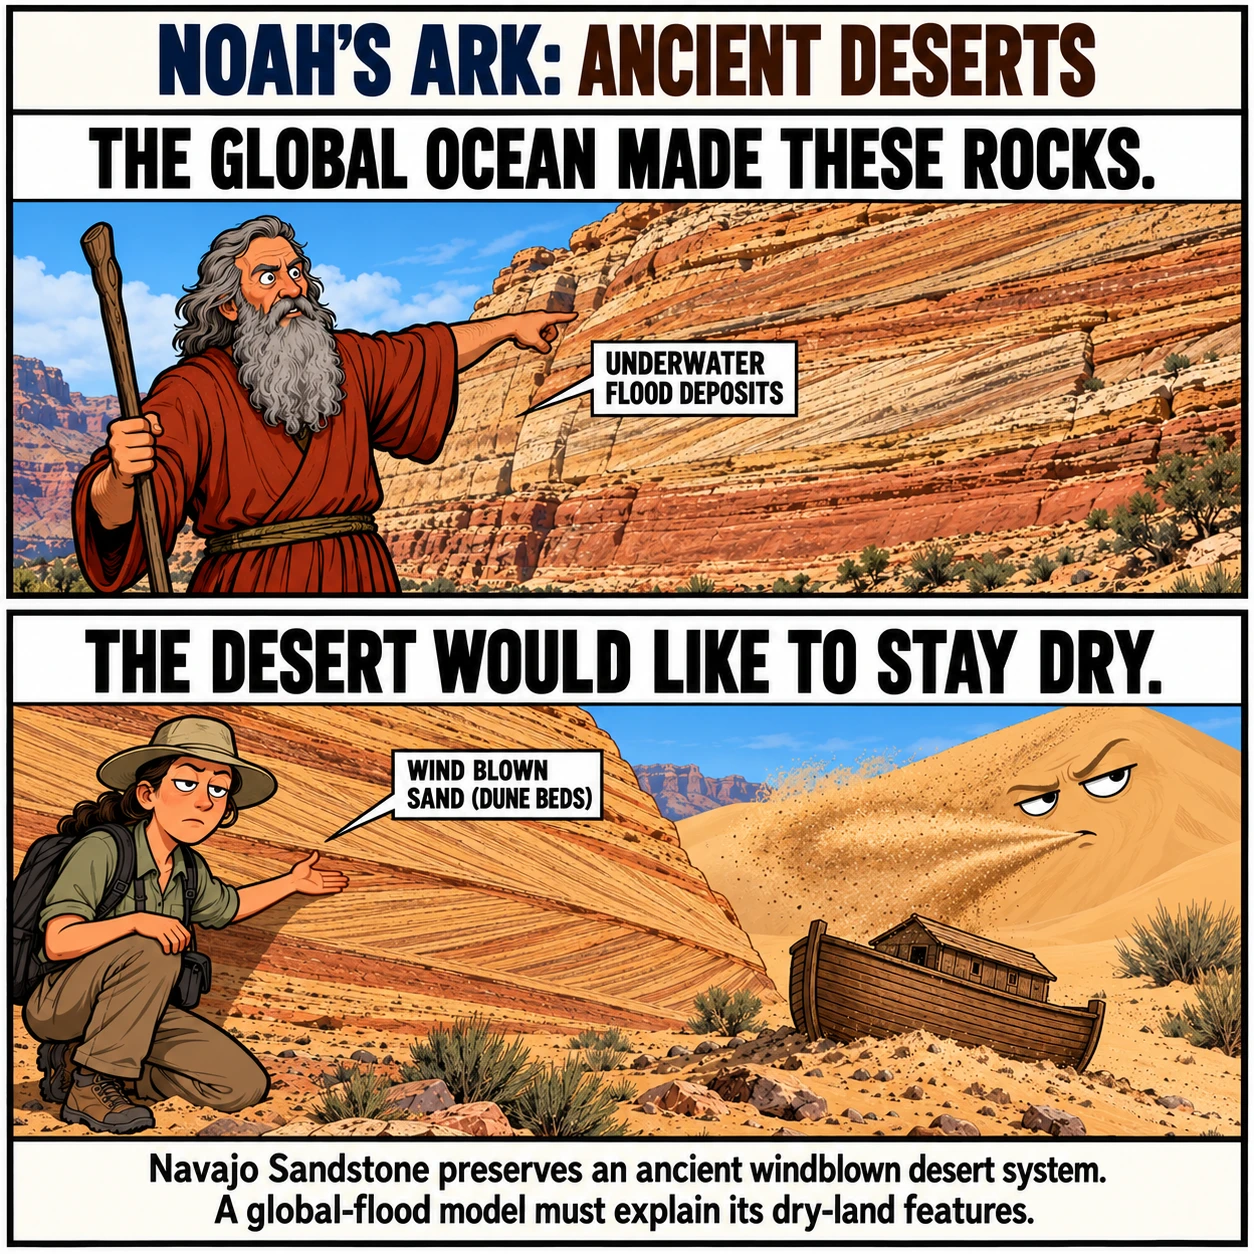
22. Ancient desert dunes cannot all be products of underwater flooding
The Navajo Sandstone preserves an enormous ancient dune system. Its sweeping cross-beds record moving sand dunes, and its regional geology includes evidence of dry desert conditions alongside local wetter environments.
Underwater currents can also produce cross-bedding. Consequently, "it has angled layers" is not enough to identify a desert. Geologists use the scale and architecture of the deposits, grain characteristics, and associated structures to distinguish environments.
The relevant contradiction is the identification of extended windblown dune accumulation within rock sequences sometimes assigned to the flood. A desert surface with migrating dunes cannot simultaneously be the floor of a deep ocean covering all the mountains.
Proposing that these dunes formed before or after the flood gives up the claim that the flood deposited them. Proposing repeated dry intervals during the flood must explain how their extent, sediment supply, and associated environments fit the story's chronology. The observed rocks already have a coherent explanation as an ancient desert system.
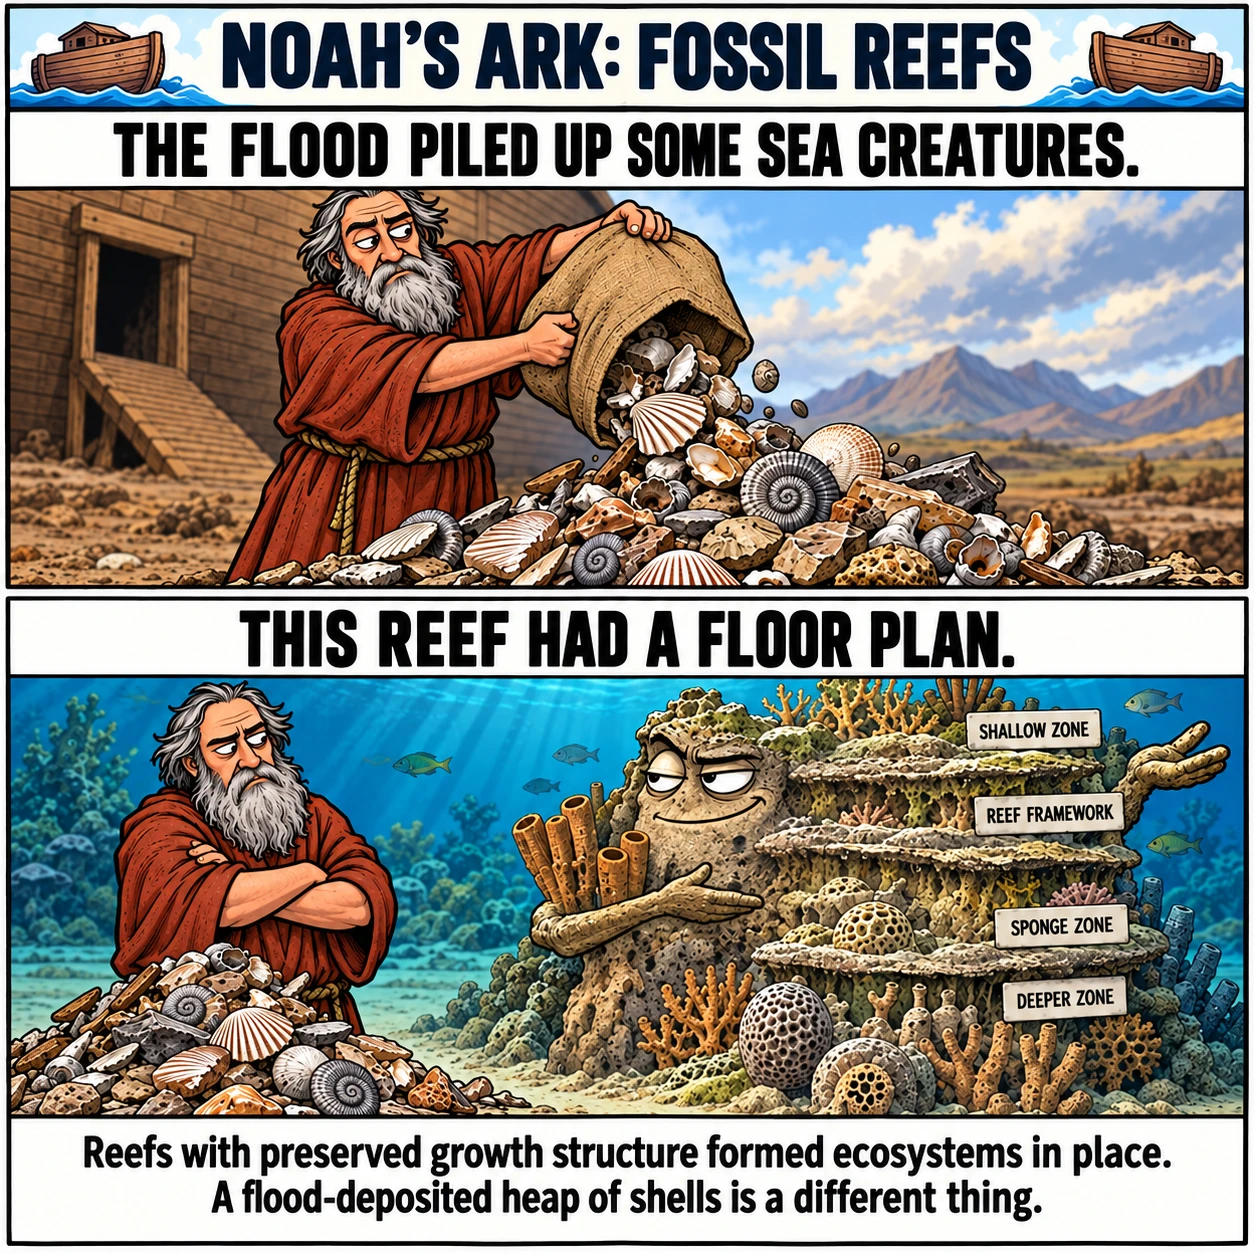
23. Fossil reefs preserve ecosystems that grew in place
A reef is more than a heap of marine fossils. Its structure can preserve where organisms grew and how the reef related to the adjacent seafloor, basin, and shallower environments.
The Capitan Reef, exposed in the Guadalupe Mountains and nearby areas, is a well-studied Permian reef system. Its builders included organisms different from those dominating many modern coral reefs. The surrounding geological relationships reveal a long-lived marine environment followed by later burial, uplift, and erosion.
A flood can break a reef and carry its fragments elsewhere. It cannot explain an entire reef system simply by sorting floating carcasses into a pile. Growth relationships and environmental zones must also be accounted for.
This evidence challenges the claim that such limestone bodies formed wholesale during one recent flood. It should not be confused with the separate argument about living reefs surviving the proposed catastrophe. Here the problem is the recorded history of reef construction and subsequent geological change.
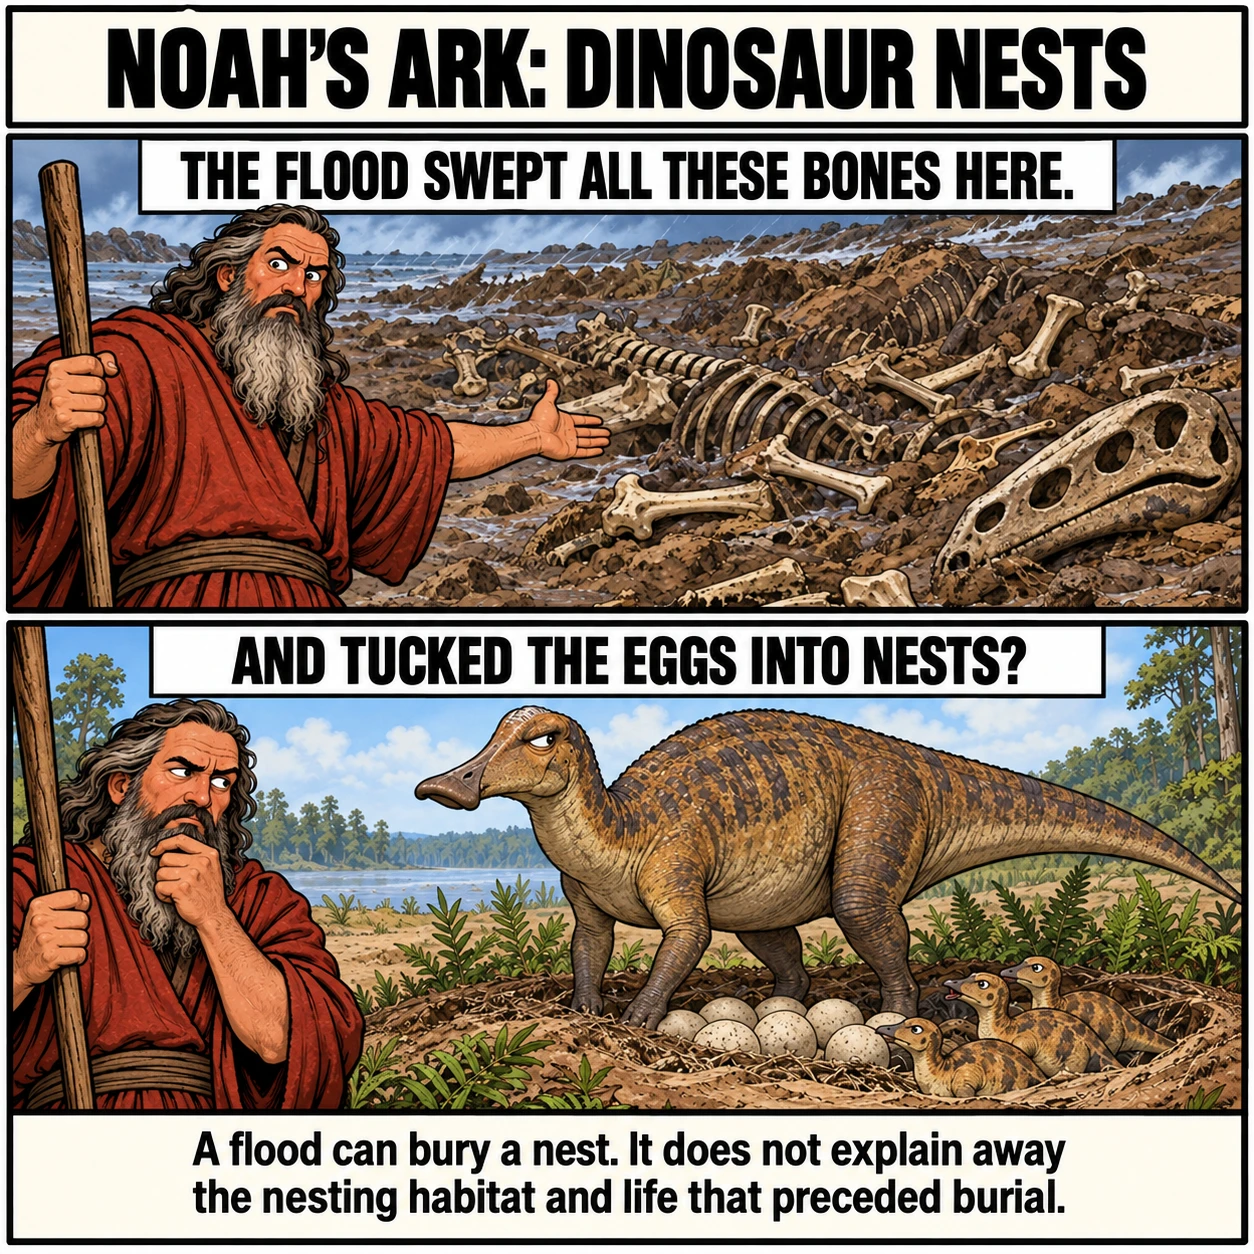
24. Dinosaur nesting sites record ordinary reproduction on land
Fossil evidence includes behaviour, not only dead bodies. At Egg Mountain in Montana, nests, eggs, and young dinosaurs helped establish that some dinosaurs nested in colonies. The evidence comes from the arrangement and context of the remains.
A local flood can bury a nesting ground rapidly. That is compatible with ordinary geology and can even help preserve evidence. What burial does not explain is the preceding activity: animals selecting a site, laying eggs, and reproducing on land.
When such evidence occurs within a formation assigned to Noah's flood, the model must accommodate the living terrestrial community represented there. It cannot simply treat every fossil as an animal that drowned elsewhere and was swept into position.
One nesting surface does not prove that no later global flood occurred. It exposes the failure of a particular explanation of the fossil record, especially when considered with soils, tracks, burrows, and other evidence of life between depositional events. The rocks record episodes of habitation as well as episodes of burial.
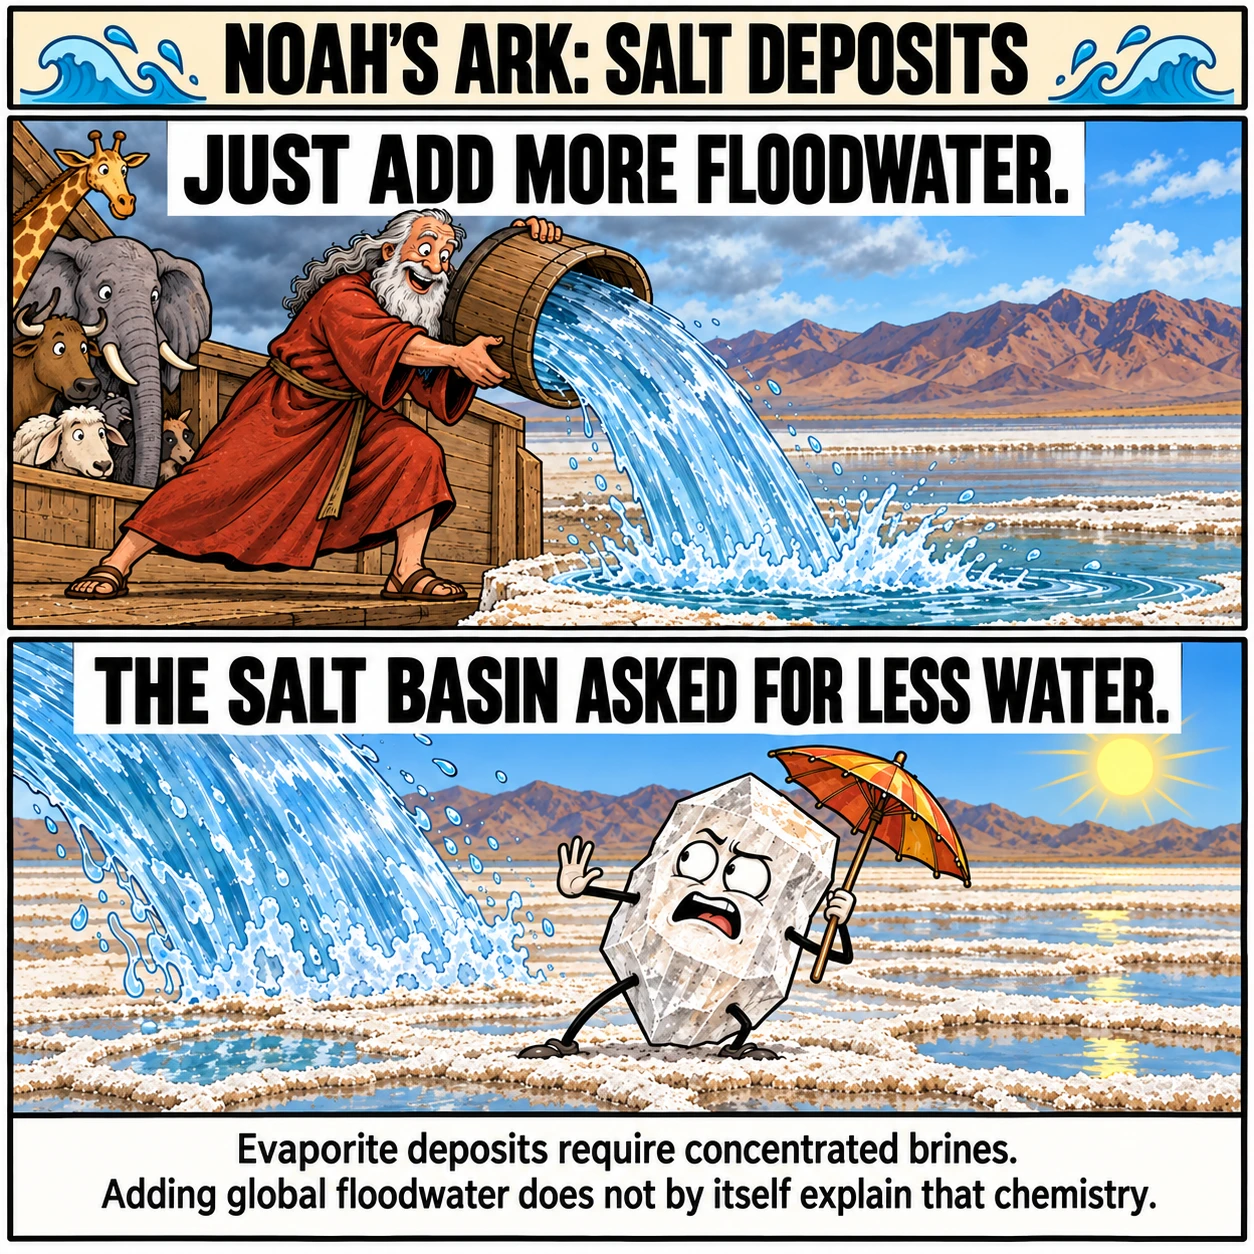
Salt and gypsum deposits often form when evaporation concentrates water until minerals precipitate. Large evaporite basins preserve thick salt sequences and particular mineral associations that reflect changing brine chemistry.
USGS work on potash resources describes extensive evaporite-bearing basins around the world. These deposits are evidence of specific chemical environments, including restricted basins in which evaporation can exceed the supply of fresh water.
That conflicts with a model that explains the same deposits as rapid accumulation during prolonged global rainfall and deep inundation. Adding vast quantities of dilute water does not provide the concentrated brine conditions required. A flood explanation must supply a convincing sequence of concentration, mineral precipitation, replenishment, and burial.
Evaporites do not all form slowly, and the mere presence of salt does not establish a minimum age. The objection concerns the chemistry and organization of entire deposits. Those features must be explained rather than dismissed as another unspecified effect of a flood.
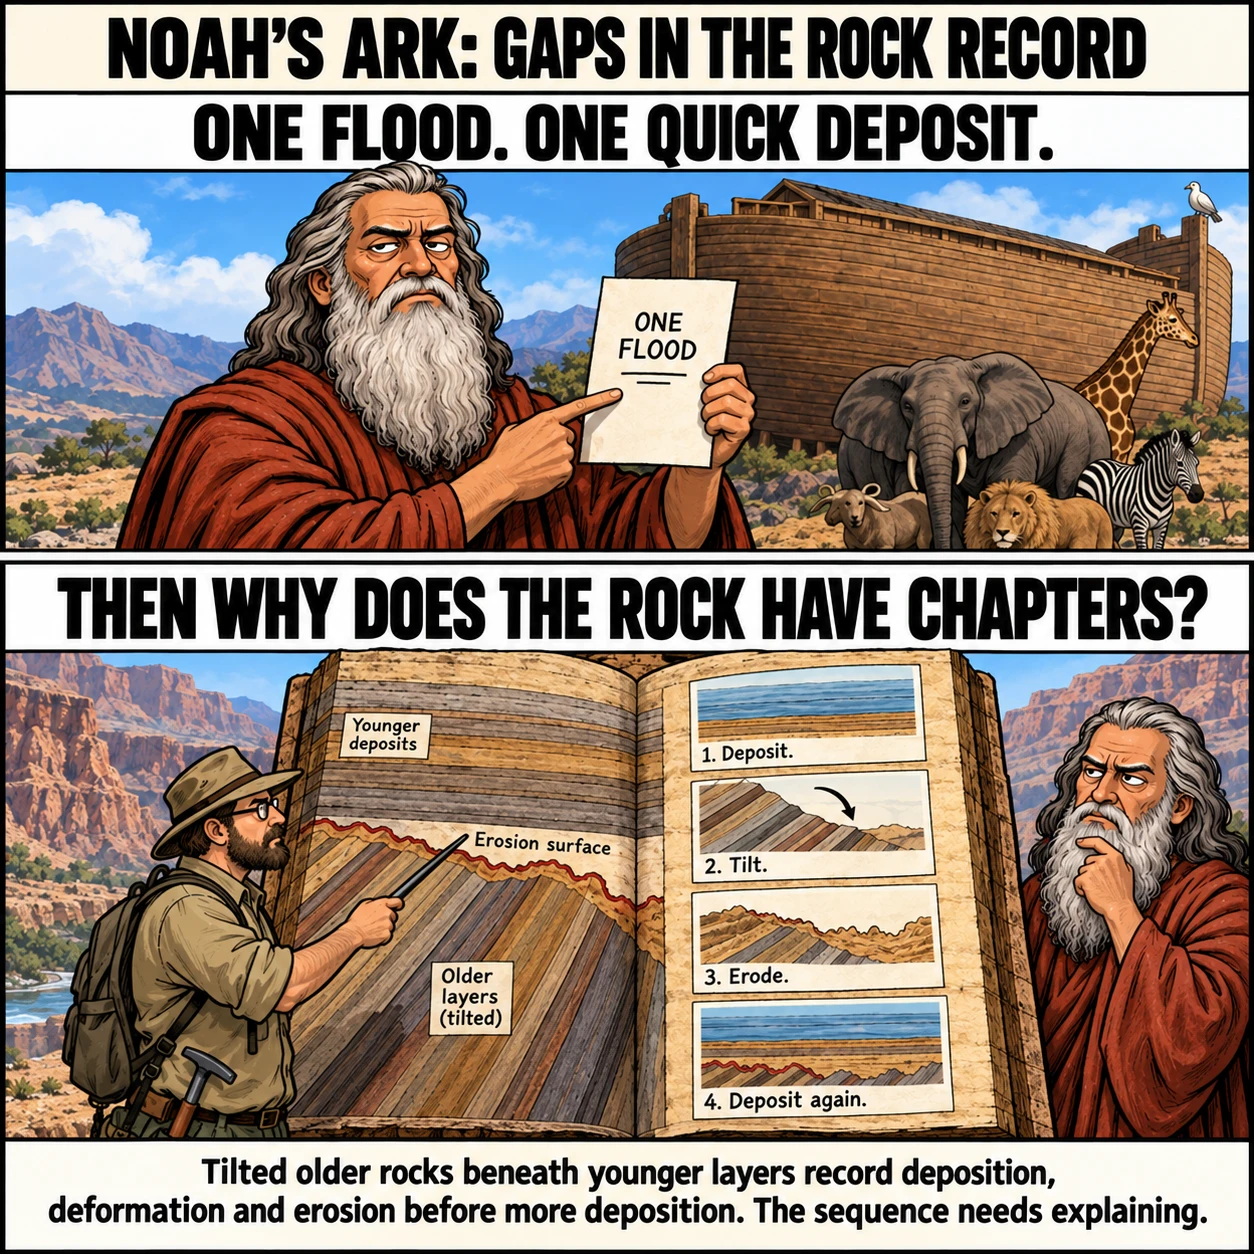
26. Unconformities record multiple geological episodes
An unconformity is a boundary representing missing geological time, often because erosion removed older rocks before younger sediments accumulated. At an angular unconformity, the older layers were tilted before the newer layers covered them.
Grand Canyon exposes striking examples. Its history includes deposition, deformation, erosion, and later deposition across older surfaces. Those relationships can be recognized in the field before assigning numerical ages.
Erosion can be fast, so an erosion surface alone is not proof of millions of years. The difficulty for a one-year flood is the required sequence of distinct events, together with dated rocks and the environments represented above and below the boundaries.
The whole package cannot be explained by saying that water rapidly laid down horizontal layers. Some layers had already formed, changed orientation, and been eroded before the next package arrived. The field relationships demand a history that flood geology must reproduce in detail, not merely a large quantity of moving water.
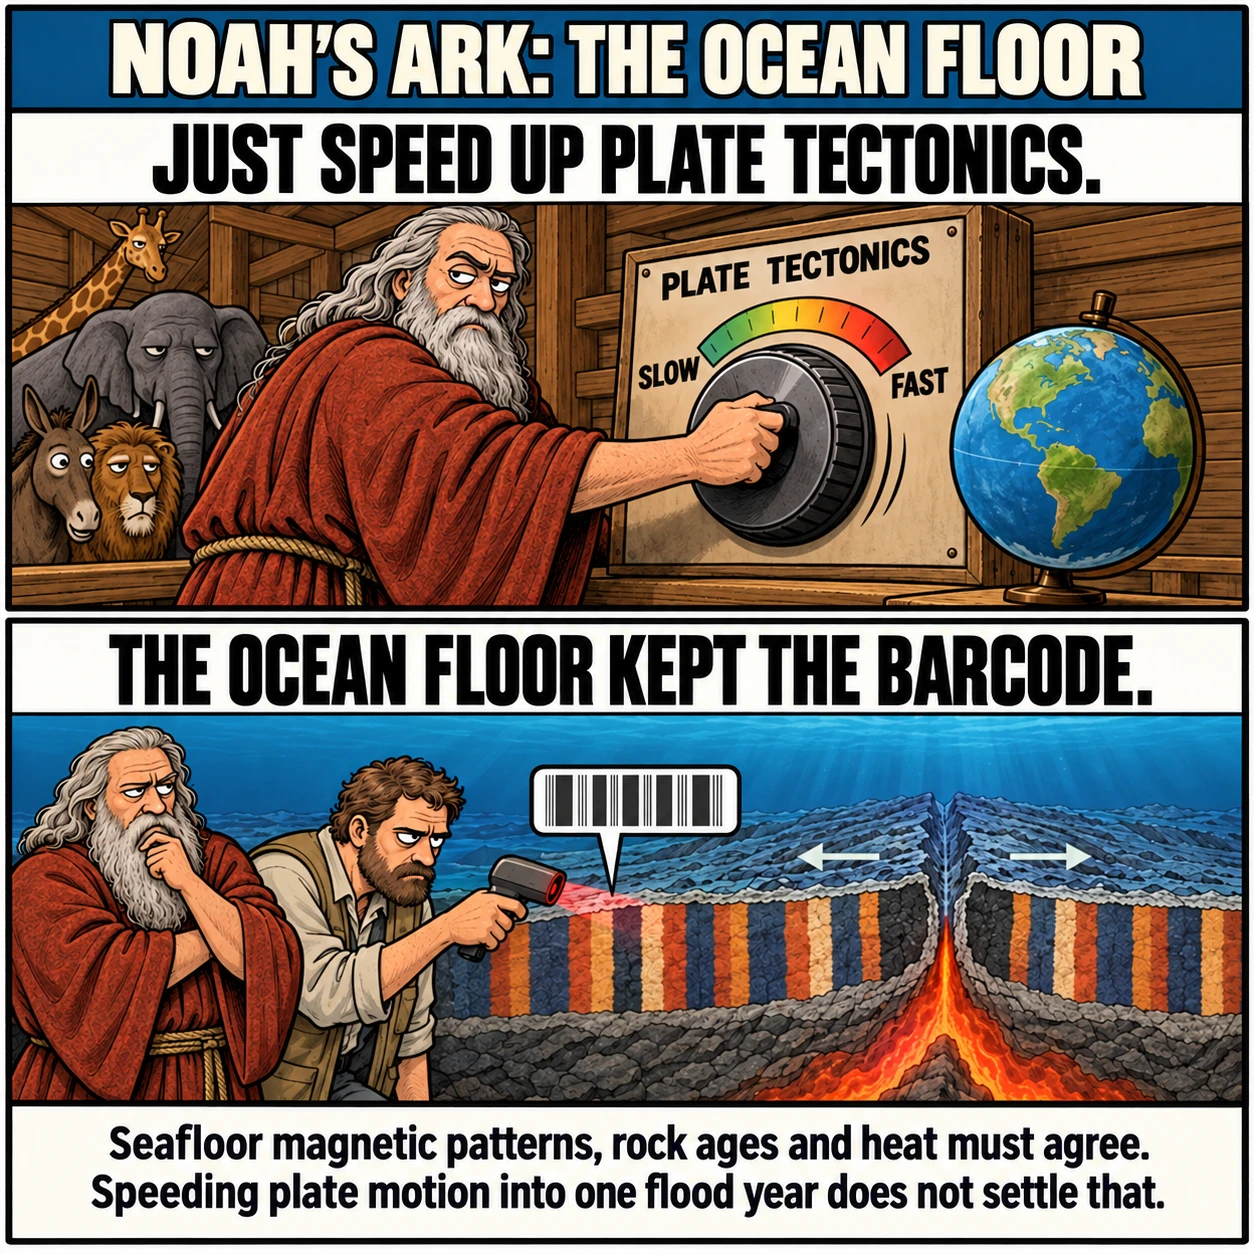
27. The seafloor records spreading over a long history
Ocean crust preserves magnetic bands on either side of spreading ridges. As new volcanic rock cools, magnetic minerals record the field's polarity. The pattern can be compared with independently dated magnetic reversals, and crust generally becomes older away from the ridge.
That combination supplies a history of ocean-basin development. It contradicts proposals that compress most seafloor production and continental motion into the flood year. Such a model must reproduce the magnetic sequence, rock ages, crustal temperatures, and sediment cover together.
Simply increasing plate speeds does not preserve the rest of the physics. Rapidly creating and cooling an ocean floor also changes heat transfer and the behaviour of the crust. These consequences need calculations, not an appeal to a faster version of the modern process.
The argument is directed at catastrophic plate-tectonic explanations of the flood. It does not assume that plate speeds have always been constant. The geological evidence itself constrains how motion changed through time.
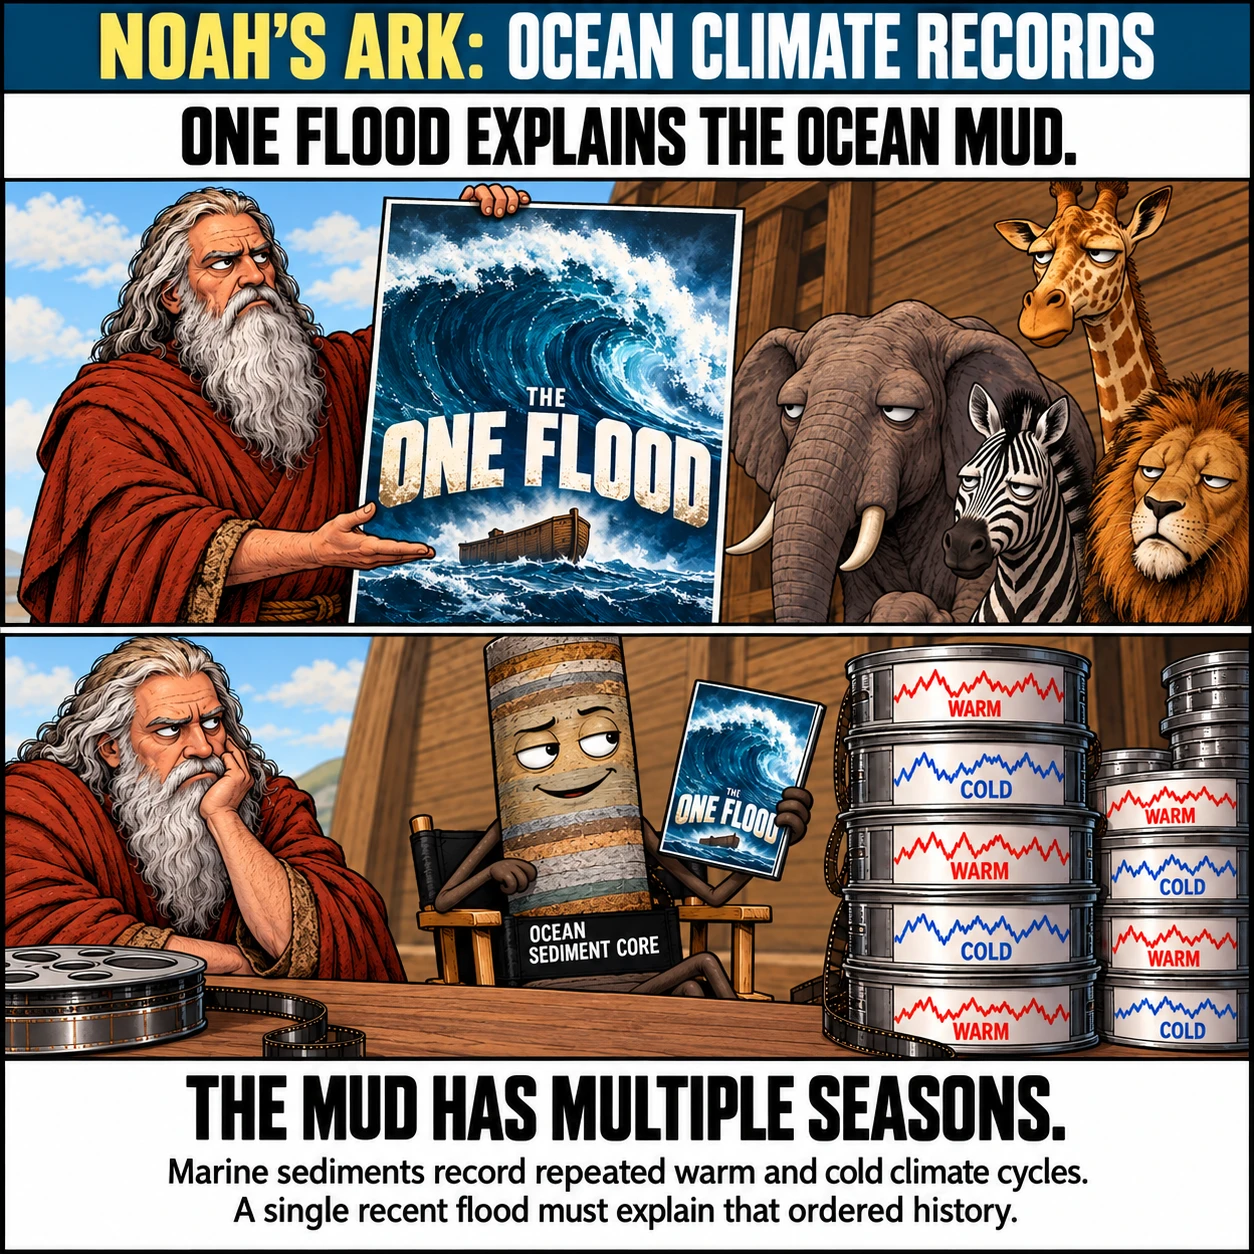
Microscopic marine shells record changes in ocean conditions through their oxygen isotopes. Combined with other evidence, these measurements help reconstruct deep-water temperatures and the amount of water stored in ice sheets.
Lisiecki and Raymo combined 57 records into a widely used sequence extending back about 5.3 million years. It contains repeated climate cycles, not one episode of universal flooding and sediment settlement.
Its age model includes orbital tuning, so the cycle timing is not wholly independent of assumptions about Earth's orbital influence. That does not erase the measured sequence or the differences among sediment layers. A flood explanation must still account for their composition, order, and relationship to other records.
This is another objection to compressing most geological history into one catastrophe. It also undermines the suggestion that all evidence of former ice ages represents a single brief post-flood interval. The environmental record repeatedly changes in ways consistent with extended climate history across many locations.
29. Known water reservoirs cannot cover today's mountains
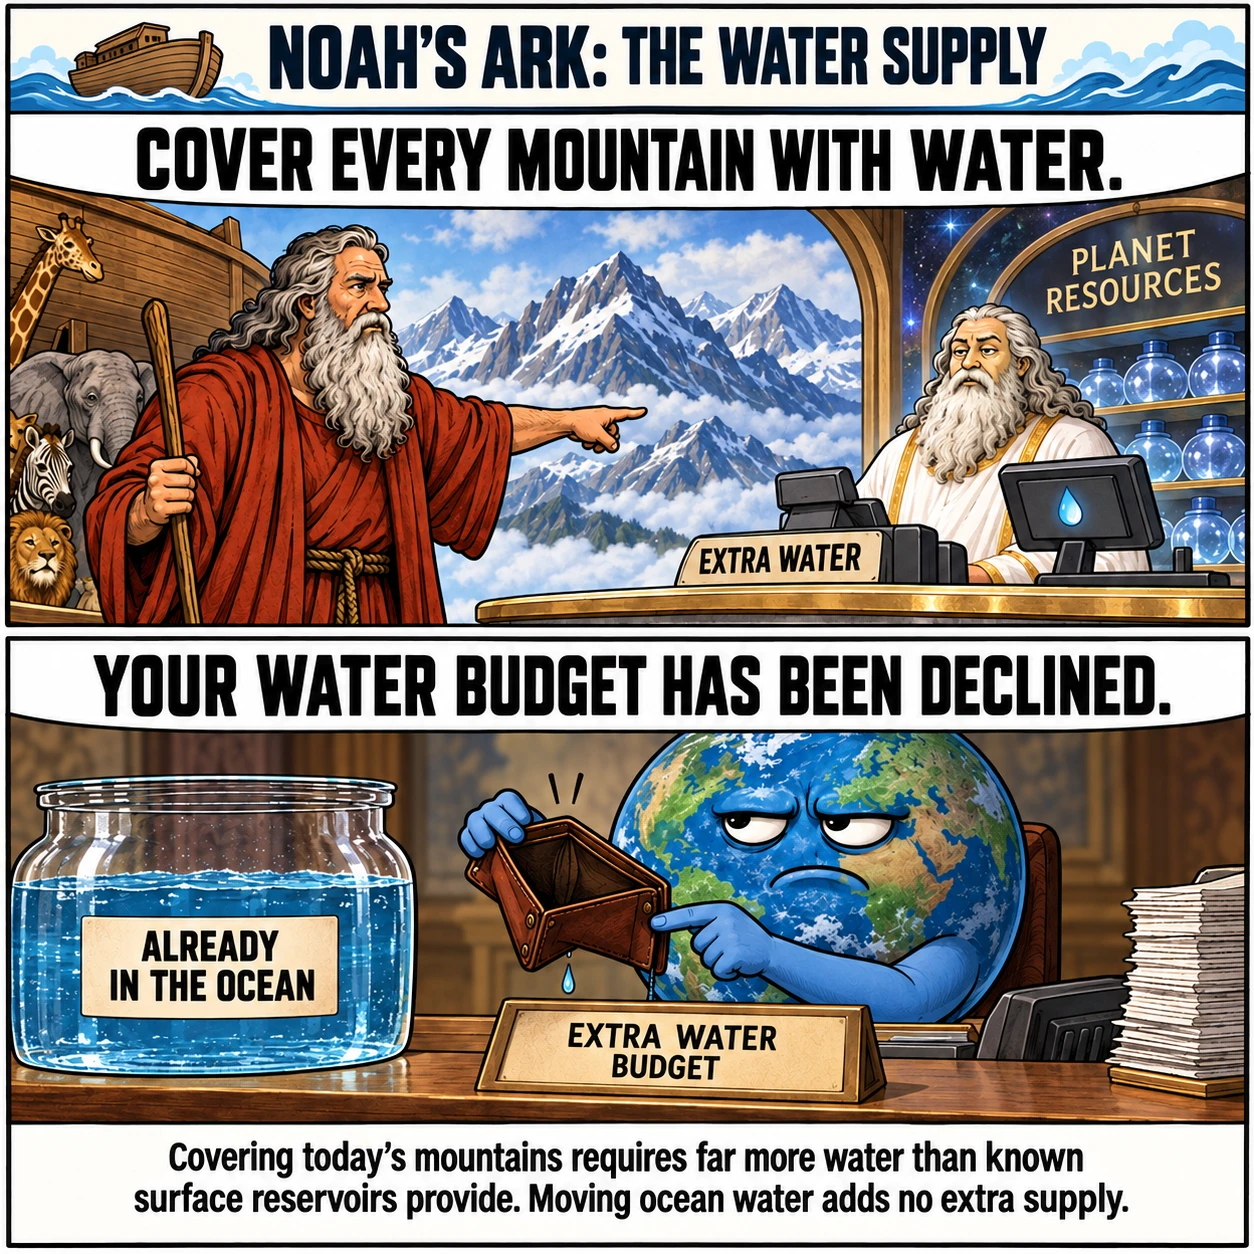
USGS estimates about 1.386 billion cubic kilometres of water in the near-surface reservoirs it inventories, most already in the oceans. Moving water between those reservoirs does not create an additional ocean above the continents.
An illustrative calculation shows the scale. Today's oceans occupy roughly 361 million square kilometres. Raising water over that area alone by 8.8 kilometres requires about 3.2 billion additional cubic kilometres. The arithmetic is 361 million km² × 8.8 km ≈ 3.18 billion km³, about 2.3 times the entire 1.386 billion km³ inventory just cited, in additional water alone. Flooding the land increases the requirement. This is a lower-bound geometric estimate for present-day topography, not a precise reconstruction of an ancient Earth.
Melting ice and emptying ordinary groundwater stores cannot supply that quantity. Most of the planet's inventoried water is already below sea level.
Flood advocates sometimes propose lower pre-flood mountains or radically different ocean basins. That changes the calculation, but it introduces a new requirement: explain how today's topography formed on the proposed timescale. The water-budget objection is decisive against flooding present-day mountains with known surface and groundwater reservoirs; it is conditional on the topography being proposed.
30. Rain recycles water rather than manufacturing a global ocean
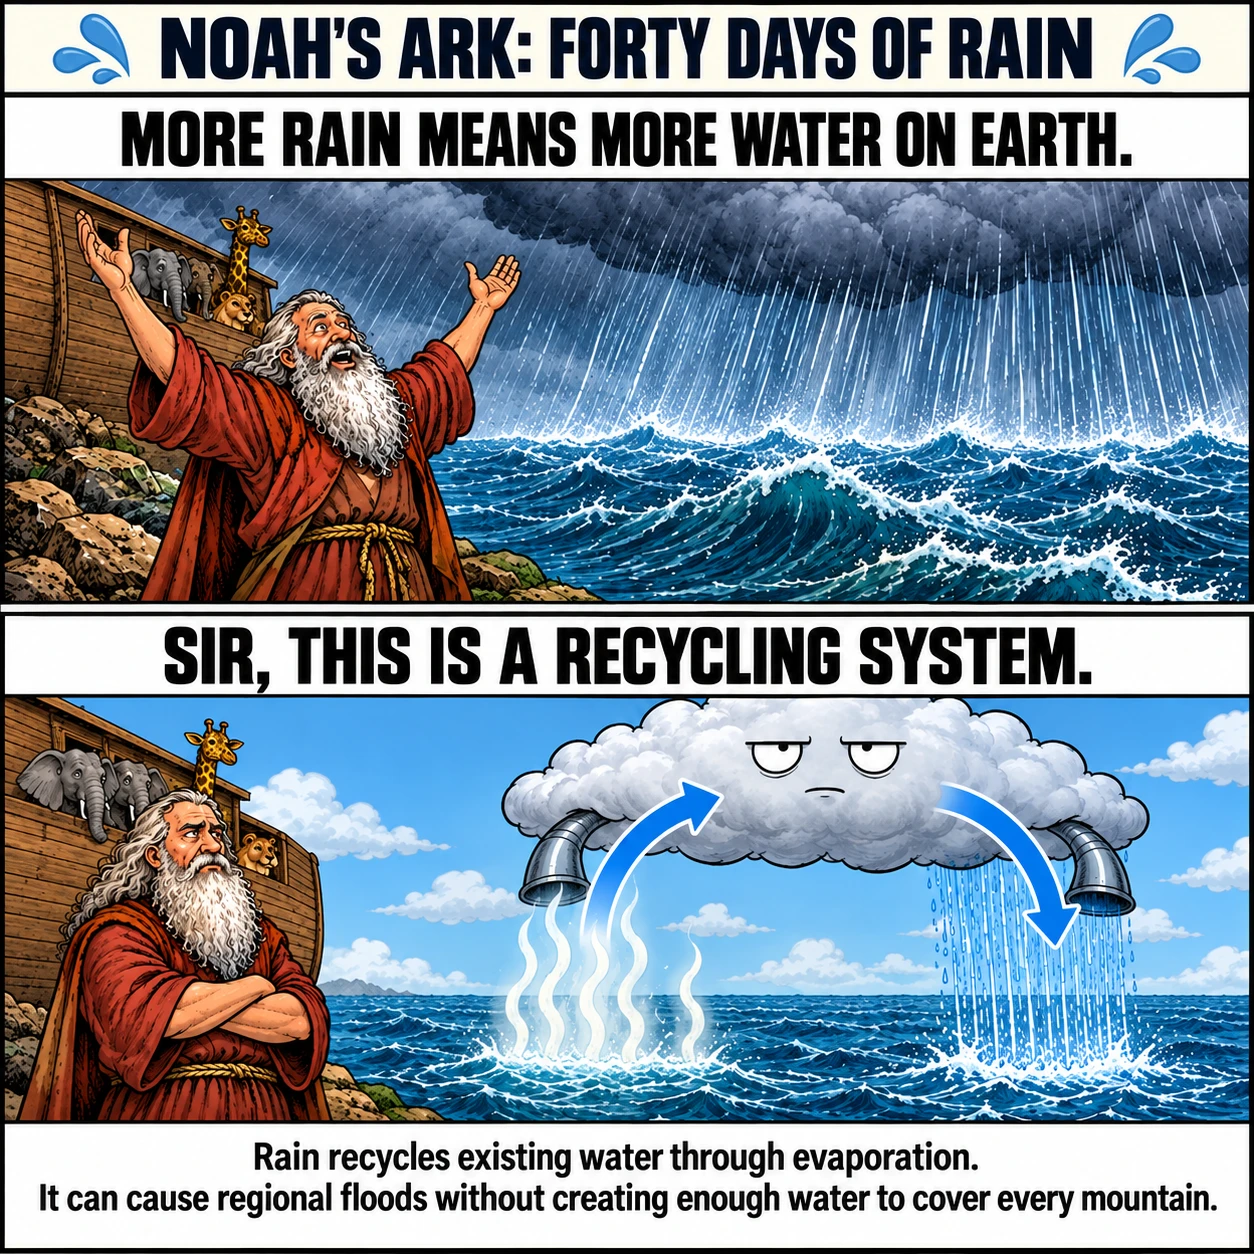
Rainwater comes from water that has entered the atmosphere through evaporation and related processes. Sustained rainfall can repeatedly draw on that supply, so the objection is not that a storm must stop once the atmosphere's initial moisture falls out.
The problem is conservation of water. Evaporating ocean water and raining it onto land redistributes existing water. It does not add the enormous volume required to raise the entire ocean above all mountains. Once every basin is connected, local accumulation cannot keep increasing global water volume.
NASA's description of the water cycle explains the exchanges among ocean, atmosphere, land, and ice. Those exchanges are sufficient for devastating regional floods. They do not provide a natural mechanism for the literal global event.
Genesis also mentions the fountains of the deep, so disproving rainfall as the sole source does not address every version of the story. It establishes a requirement any physical flood model must meet: identify a real source of additional water or a quantitatively defensible change in the shape of Earth's basins.
NASA estimates that the atmosphere contains about 12,900 km³ of water at any moment. Spread over 510 million km², that is 12,900 ÷ 510 million ≈ 0.0000253 km, or just 25 mm of rain. The 3.18 billion km³ lower bound above is roughly 246,000 times that atmospheric store. Replenishing clouds by evaporating the ocean moves existing water; it does not add the required net volume.
31. A global flood has no ordinary downhill outlet
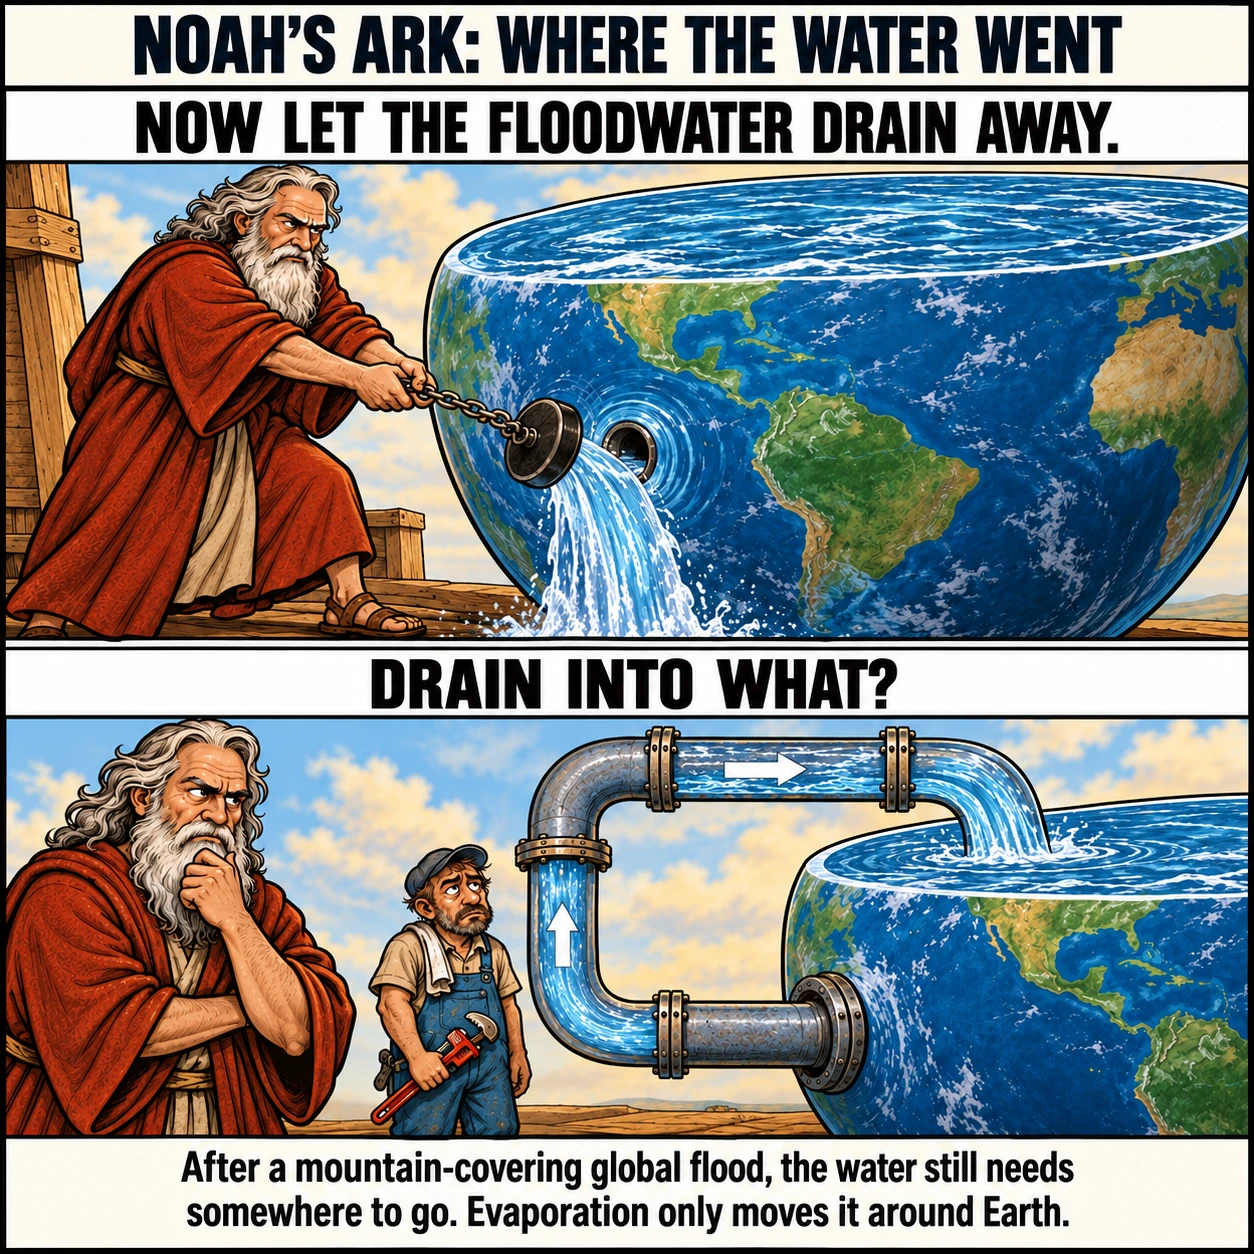
Regional floods recede when water flows into lower areas, enters available ground storage, or evaporates. A flood covering every mountain removes the usual downhill destination. All surface basins are already connected and submerged.
Wind can redistribute water and increase evaporation, but evaporation transfers water into the atmosphere. It does not remove water from Earth. If the atmosphere cannot retain the required mass, that water condenses and returns as precipitation.
This is a conservation argument, rather than a claim that the Bible contains an engineering manual. A natural explanation must account for the same water both when it arrives and when dry land reappears. Creating new ocean-basin capacity is one proposed answer, but it requires enormous geological changes whose timing must agree with the evidence.
The return to today's geography is therefore a second problem beyond supplying the floodwater. An account that explains only forty days of rain has not explained a year-long global flood followed by a habitable world.
For an illustrative 150-day removal period, disposing of 3.18 billion km³ requires an average flow near 245 billion m³ per second into some destination. Creating that much extra capacity beneath today's 361 million km² ocean footprint means an average deepening of about 8.8 km. These are consequences of the present-topography scenario, not claims that every flood model uses those timings or basin shapes. The calculation makes the missing destination explicit.
32. Condensing an enormous water-vapour canopy releases enormous heat
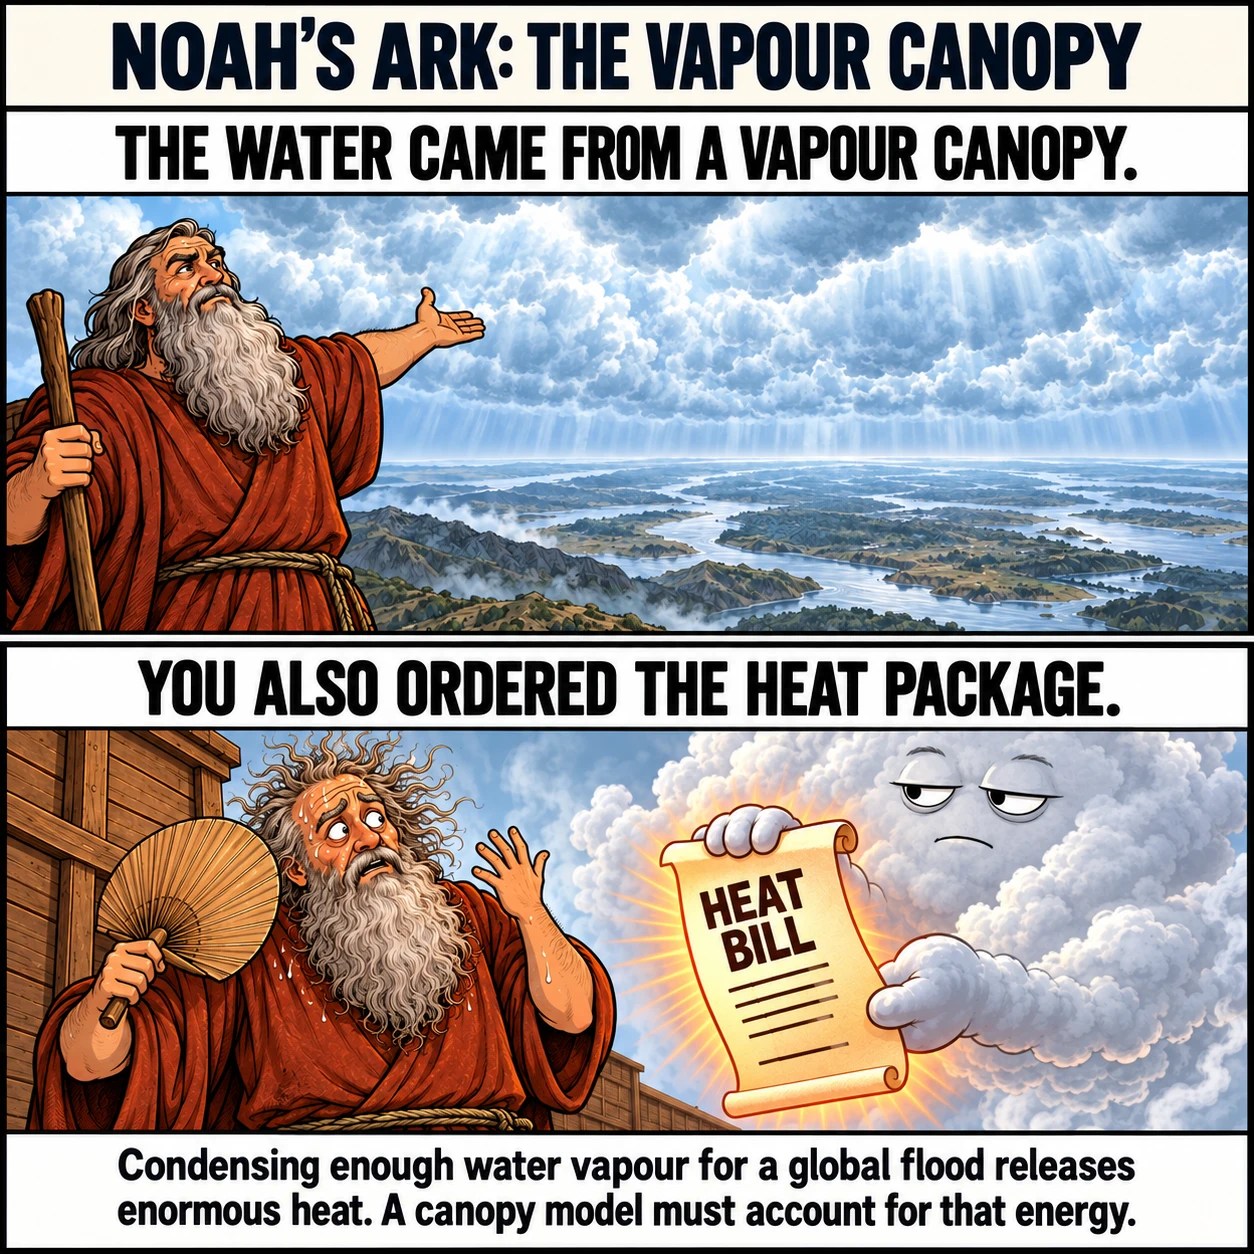
Some flood models add a large pre-flood reservoir of atmospheric water vapour. Condensation releases latent heat, so this proposal has a calculable energy cost.
For an illustrative scenario, let one kilometre of water over Earth's roughly 510 million square kilometres of surface fall from vapour over forty days. The water mass is about 5.1 × 10²⁰ kilograms. Using approximately 2.5 million joules per kilogram for condensation gives about 1.3 × 10²⁷ joules, or an average release near 720,000 watts per square metre during that interval.
That is this article's order-of-magnitude calculation, not a published climate simulation. It does not assume that all the energy stays at ground level or yield a specific final temperature. It shows the extraordinary heat-removal problem a vapour-canopy model must solve. Even this scenario supplies much less than the water needed to cover present-day mountains.
The calculation applies to water supplied as vapour and condensed during the event. It should not be misapplied to every possible liquid-water flood proposal.
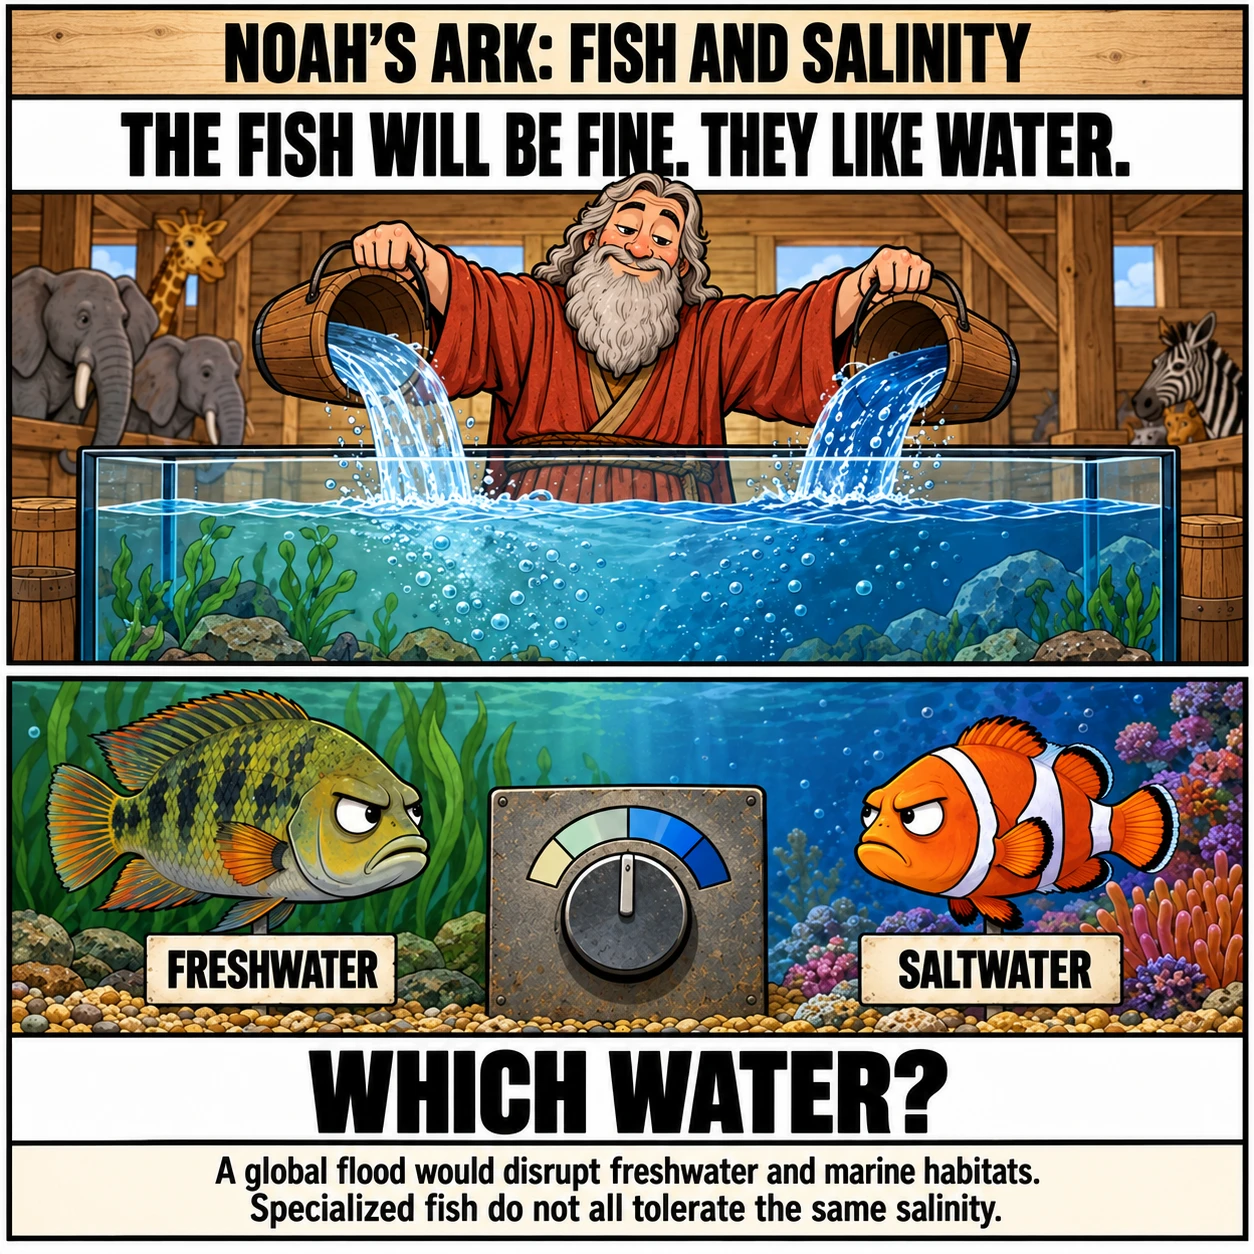
33. Freshwater and marine life cannot all be protected by the same water chemistry
Fish maintain balances of water and dissolved salts across their tissues. Freshwater and marine species face different problems, and their physiology reflects those differences. Some species tolerate broad salinity ranges; many others do not.
A global flood model must specify how fresh water and seawater interact. Extensive freshening threatens marine specialists. Saline invasion threatens freshwater specialists. Intermediate salinity is not a universal compromise that suits every species.
Water does not have to mix instantly or perfectly. Stable layers and local refuges can occur. But a model invoking violent currents, continental erosion, and deep inundation cannot also assume that every sensitive habitat remains safely isolated without demonstrating how that happens.
The existence of salmon or other adaptable fish does not answer for the rest of aquatic life. The biological problem is preserving the full range of salinity requirements through the event and restoring the observed ecosystems afterward. Excluding fish from the ark transfers the survival problem into the floodwater; it does not eliminate it.
A dilution example shows the scale of the change. Assume today's 1.338 billion km³ of ocean water starts at a representative salinity of 35 grams per kilogram. Add the earlier 3.18 billion km³ of fresh floodwater and mix it completely. Ignoring the small density difference, salinity becomes 35 × 1.338 ÷ 4.518 ≈ 10.4 grams per kilogram, less than one-third the starting value. This is an idealized mixing calculation, not a prediction that every location instantly reaches that salinity. It shows why adding fresh water does not leave marine habitats unchanged.
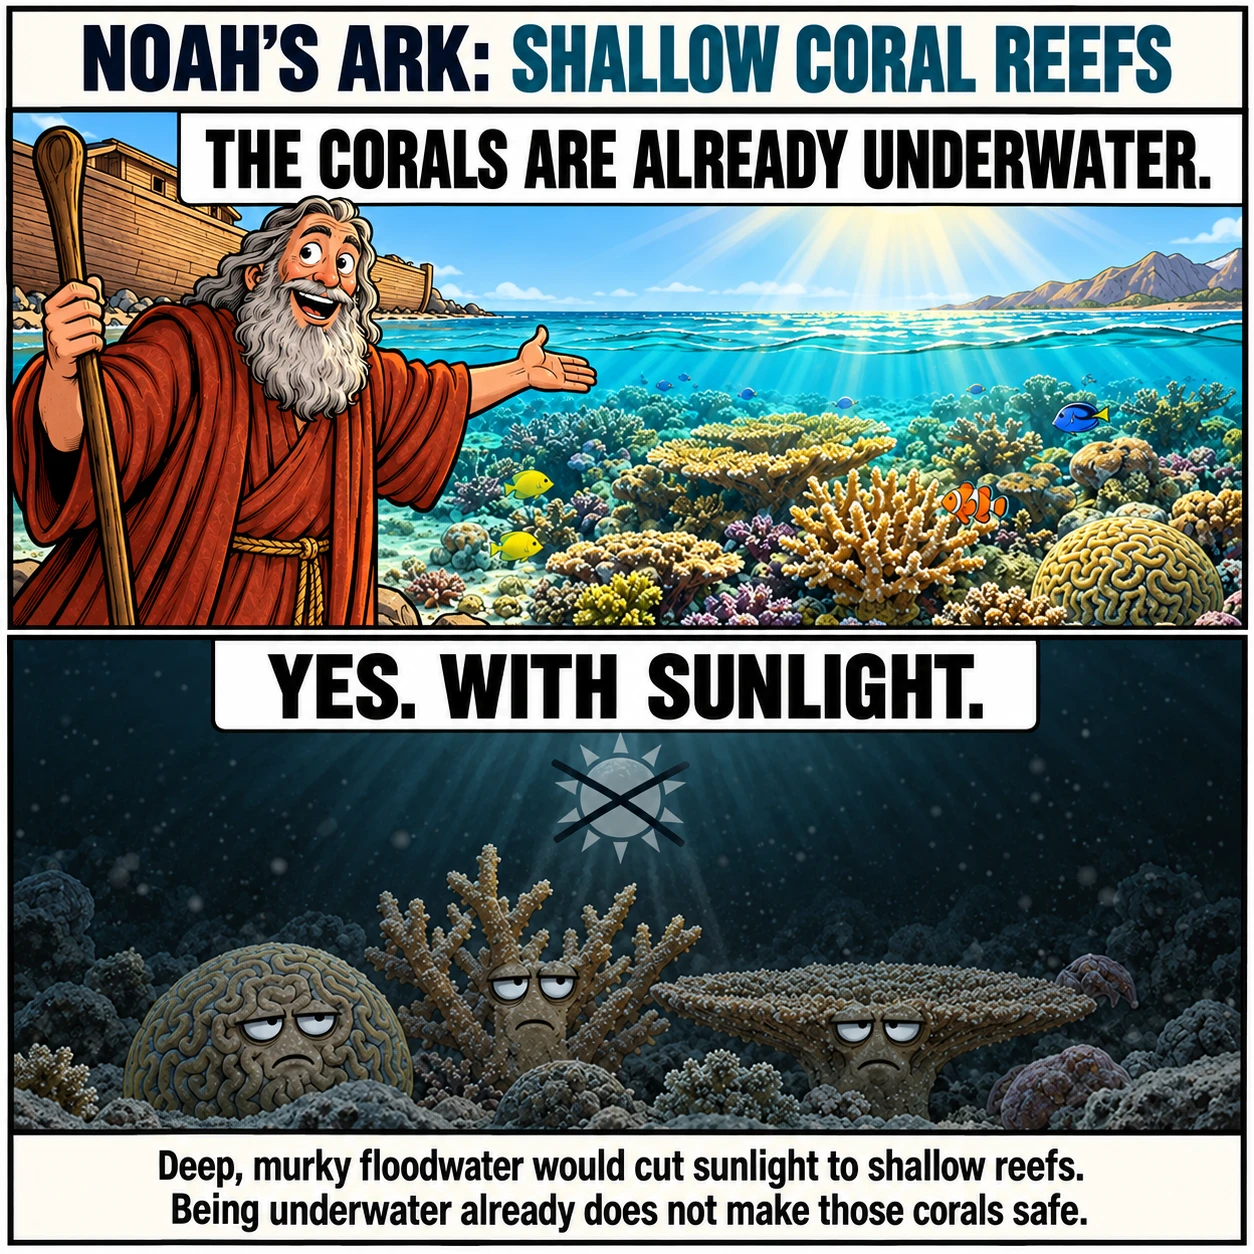
34. Living reef ecosystems need tolerable light, sediment, and water conditions
Many shallow reef-building corals depend on light for their partnership with photosynthetic organisms. Their health also depends on temperature, water chemistry, and sediment conditions. NOAA documents how heat stress, sediment, and other disturbances damage coral ecosystems.
A flood deep enough to cover mountains would move existing shallow reefs far below their usual light environment. If it also eroded continents and produced much of the sedimentary record, the resulting sediment load would compound the problem. Restoring the water level would not undo a year of unsuitable conditions.
Some corals live in deep water, and coral species differ in tolerance. The argument is not that every coral requires exactly the same conditions. It is that the known range of reef ecosystems cannot all be treated as unaffected passengers beneath a global flood.
A viable flood model needs evidence for survival, recruitment, and recovery of those ecosystems. Stating that sea creatures were already in water does not address their actual biology.
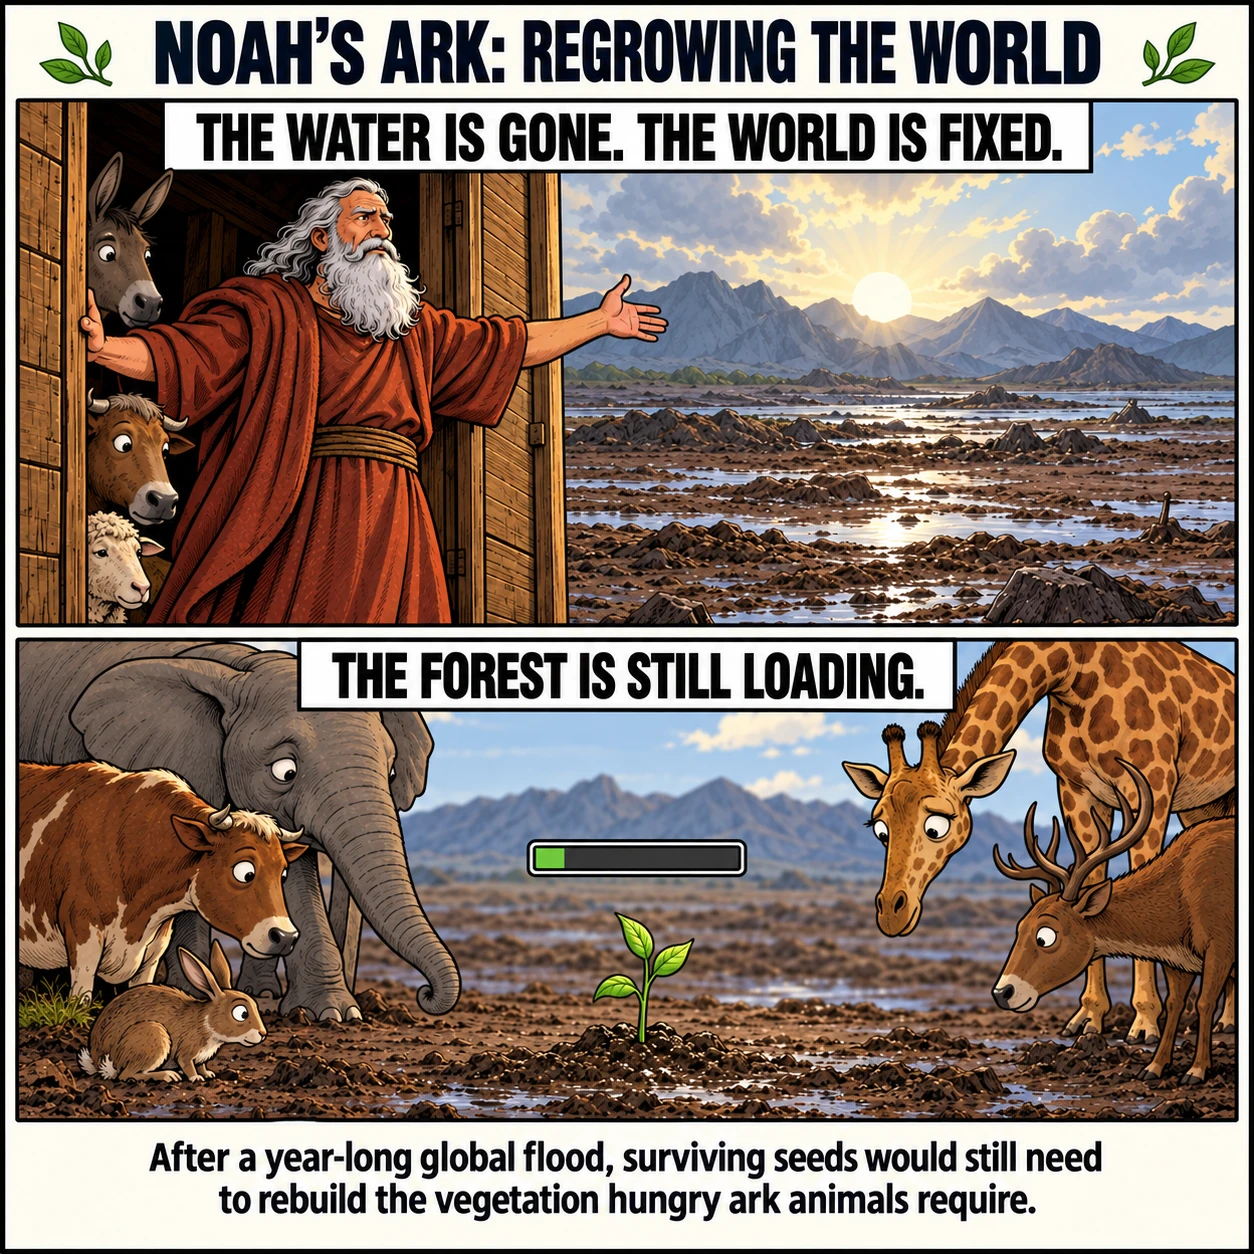
35. Terrestrial vegetation cannot be restored simply by exposing wet ground
Many land plants suffer when flooding deprives roots and tissues of oxygen. Complete submergence also changes light availability and gas exchange. Flood-tolerant plants have specific adaptations; their existence does not make prolonged submergence harmless to all vegetation.
Research on submerged terrestrial plants shows how survival depends on species, conditions, and the ability to maintain photosynthesis and internal oxygen. A mountain-covering flood, especially one carrying large quantities of sediment or salt, presents a much greater challenge than ordinary seasonal waterlogging.
Some seeds and plant fragments can survive flooding and disperse. The claim that every seed would die is false. The unresolved problem is rebuilding forests, grasslands, and specialized plant communities rapidly enough to support the returning animals. Seed survival is only one step; germination, soil conditions, growth, and ecological relationships also matter.
An olive leaf in the narrative does not establish a general recovery mechanism for Earth's flora. The story's quick return to a functioning terrestrial world requires biological processes that the proposed catastrophe would severely disrupt.
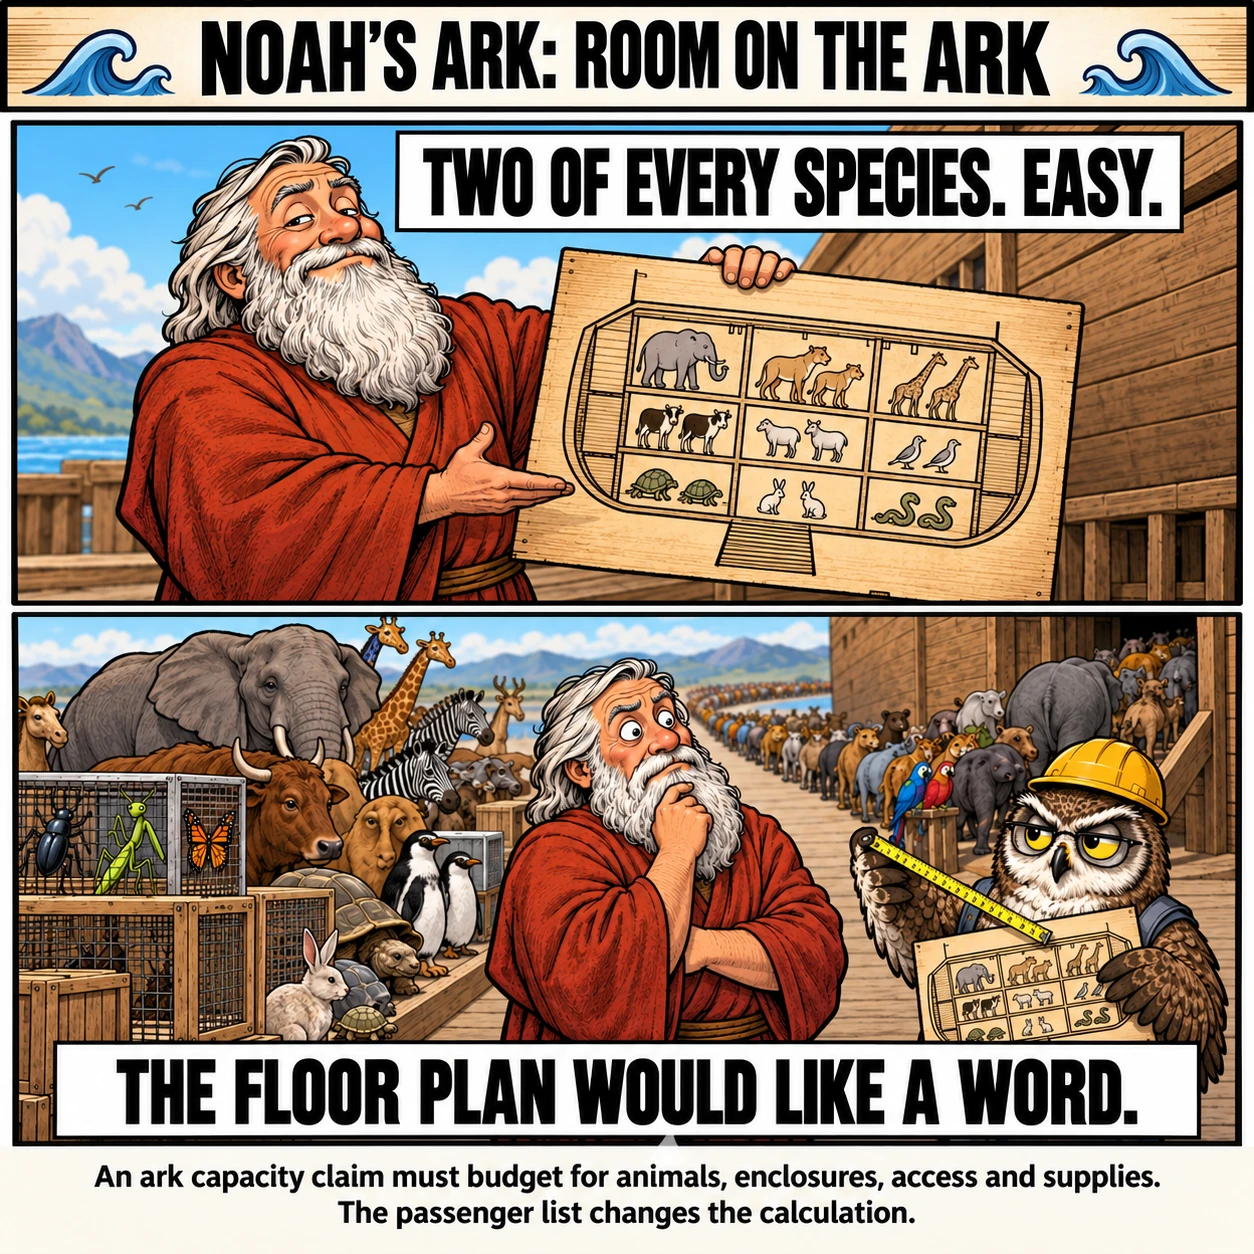
36. The ark's space budget cannot accommodate two of every animal species
The ark had to keep its passengers alive for roughly a year. Animals needed room to eat and move, predators needed separating from prey, and the crew needed access to care for them. All of that had to fit inside one wooden boat, alongside its supplies.
Genesis gives the ark three decks and dimensions of 300 × 50 × 30 cubits. Using a 0.45-metre cubit, that becomes 135 × 22.5 × 13.5 metres: about 41,006 m³ of volume and 9,113 m² of floor across three rectangular decks. Allow an illustrative 30% for structure, passages, and unusable corners, and about 28,704 m³ and 6,379 m² remain.
The full survival problem involves millions of species. Mora and colleagues estimated 7.77 million animal species worldwide, including 2.15 million marine species. That leaves approximately 5.62 million nonmarine species, including insects and freshwater animals. At two individuals per species, that means 11.24 million animals to accommodate or explain surviving elsewhere. This is an estimate that includes undiscovered species, not a completed census or a claim that two individuals guarantee survival.
Space needs differ enormously, so calculate these groups separately. For that vertebrate subset, assume half a square metre per animal: 39,520 species × 2 × 0.5 = 39,520 m², about 6.2 times the available floor. Cutting the list to 30,000 species still requires 30,000 m². Neither figure includes additional clean animals and birds.
Insects belong in the calculation too. Give each pair an illustrative one-litre container: one million named insect species × 0.001 m³ = 1,000 m³. Stacked three metres high, those containers alone occupy about 333 m², before shelving, access, food, or breeding materials. One litre is a space assumption, not a claim that every insect could survive in a jar. This counts only named insects; the full estimate includes millions more animals whose housing requirements need accounting for.
Those 6,744 animals would use 3,372 m² at the same half-square-metre average, leaving about 3,007 m². With enclosures averaging one metre high, they occupy 3,372 m³. That fits on paper, provided we accept both the disputed passenger list and the assumed cage sizes. Stacking cages could save floor space; a longer 0.525-metre cubit increases floor area by 36% and volume by 59%. The result depends on those choices.
But shrinking the list creates another problem. As section 40 explains, 1,398 founding kinds must produce roughly 40,000 species within about 4,500 years, averaging 29 descendant species per kind. No evidence establishes that these proposed ark founders produced the observed diversity on that timetable. Calling them "kinds" saves deck space; it supplies none of the missing evolutionary history.
Leaving insects outside does not make them flood-proof. Submerged insects can lose access to oxygen, food, and breeding sites. In tiger-beetle experiments, larvae survived severely oxygen-depleted water for an average of roughly 2.5-5 days. Some insects have flood-resistant stages; that does not establish survival through a year-long catastrophe. Aquatic animals face changes in salt concentration, while reef life faces burial and other habitat damage. Animals unable to tolerate those conditions would need protected refuges or rescue. Being able to swim is no answer.
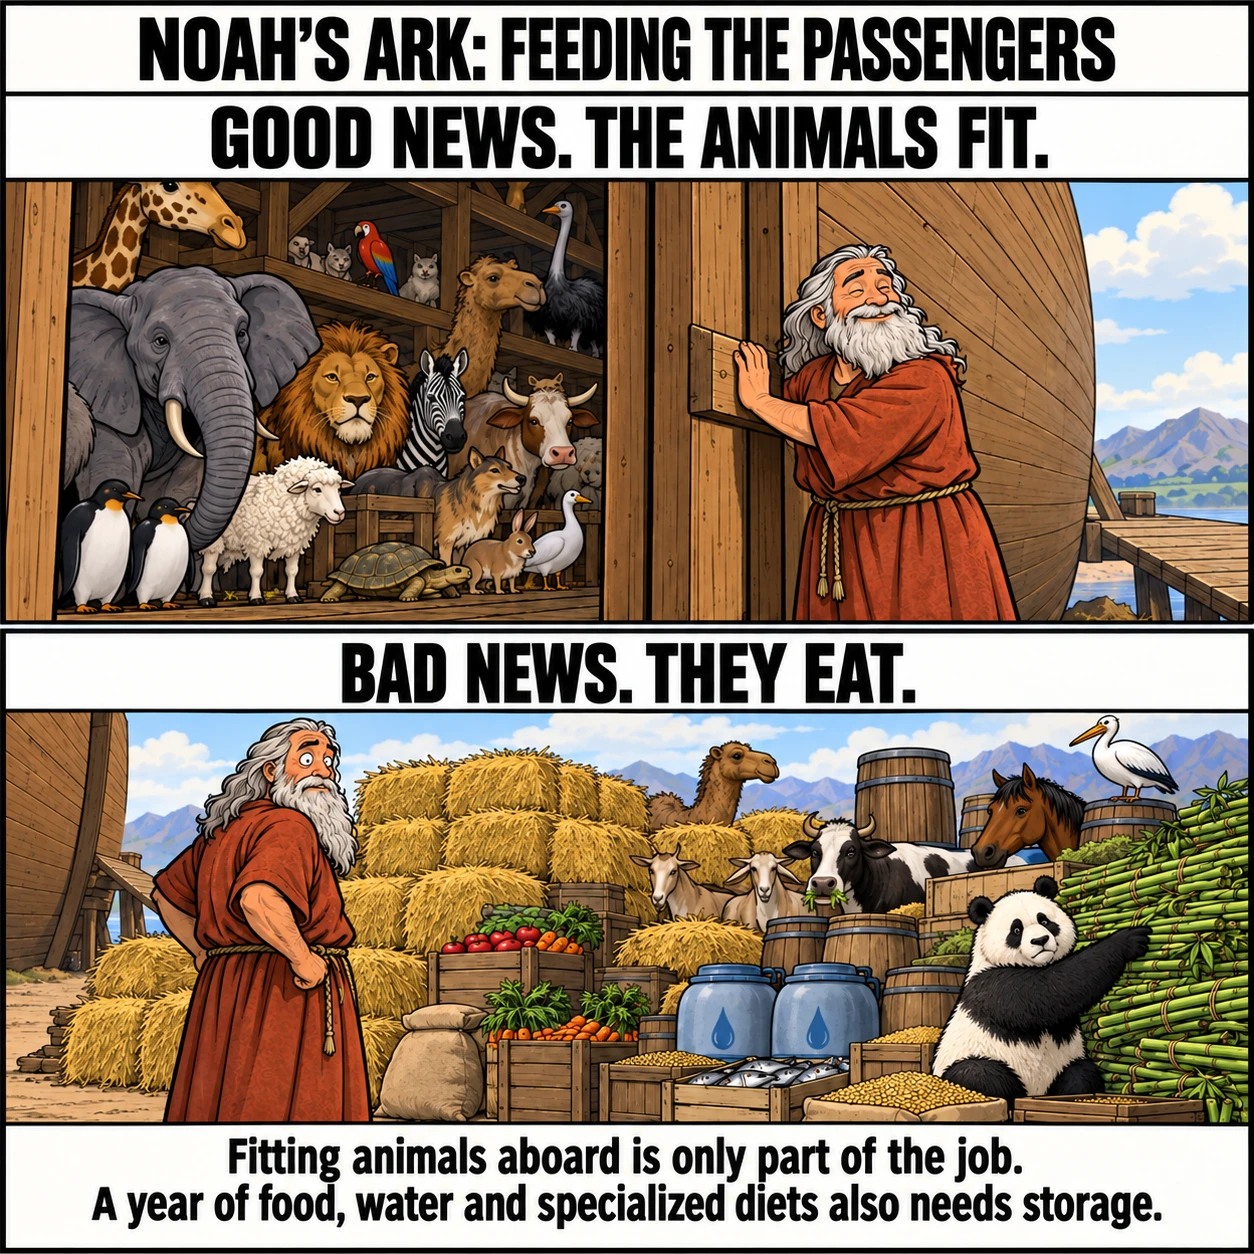
Even this partial list of about 1.04 million documented species requires roughly 39,520 + 333 = 39,853 m² of usable floor under the housing assumptions above. The ark provides only 6,379 m². Fitting two of each is therefore impossible in this layout: it needs about 6.25 times the usable floor area, equivalent to a three-deck ark about 2.5 times as long and 2.5 times as wide, keeping the same proportion of usable space. That conclusion uses known species, not the estimated millions still undiscovered. It still leaves marine life without a complete housing and life-support allowance, and includes no space for food, drinking water, or the crew's living quarters. Those needs make the shortfall larger.
37. A year's food and water compete with animal space
Use the smaller inventory of 6,744 animals and assume an average body mass of 25 kg. This is a sensitivity assumption, not a measured average for Ark Encounter's proposed passengers. Total animal mass = 6,744 × 25 = 168,600 kg, or about 169 metric tonnes.
For a simple feed budget, assume daily dry food equal to 2.5% of body mass for 365 days. University of Maine guidance puts cattle and sheep at roughly 2-3% daily dry-matter intake. Applying that rule to the whole collection gives a hay-equivalent storage scenario, not a nutritionally valid menu for birds, reptiles, carnivores, and every other animal. Assume the stored feed is 90% dry matter and has a bulk density of 160 kg/m³, approximately the 10 lb/ft³ density used in Virginia Tech's baled-hay guidance. This grants compact storage without demonstrating how Noah would achieve it. Sources: University of Maine, calculating forage requirements and Virginia Tech, hay density and storage.
Stored feed mass = 6,744 × 25 kg × 0.025 × 365 ÷ 0.90 ≈ 1,709,000 kg. Feed volume = 1,709,000 ÷ 160 ≈ 10,684 m³. That is about 37% of the usable volume before containers, spoilage allowance, or the animals themselves. Halving packing density doubles the storage volume. A 10% extra feed allowance adds roughly 1,068 m³.
Water needs its own budget. At an illustrative five litres per animal per day, demand = 6,744 × 5 = 33,720 litres daily. A year's supply occupies about 12,308 m³ and weighs about 12,308 tonnes. A 30-day reserve still occupies 1,012 m³. Those figures exclude washing, human consumption, and evaporation. Five litres is a modelling assumption; actual needs depend on species, diet, size, and temperature. A shorter reserve requires a dependable source of fresh replacement water throughout the voyage.
Now compare floor use without counting the same space twice. Put feed and the 30-day water reserve in dedicated storage areas three metres high, separate from the animal enclosures. Animal floor 3,372 m² + feed floor 10,684 ÷ 3 ≈ 3,561 m² + water floor 1,012 ÷ 3 ≈ 337 m² gives about 7,270 m². That exceeds the assumed 6,379 m² usable deck area by approximately 892 m², before further equipment and living quarters.
That result depends on the assumptions. With a 10 kg average animal instead of 25 kg, and the same enclosure and drinking-water allowances, feed volume falls to about 4,274 m³ and combined floor use to about 5,134 m². It fits this simplified budget. Taller stores or storage above enclosures can also change the layout, subject to structural and access limits. The calculation rules out the first allocation, not every conceivable allocation.
For comparison, the 80,000-animal vertebrate comparison at a much smaller assumed average mass of 2 kg still requires about 10,139 m³ of feed under the same feeding rule. That is a separate scenario, not food to add to the kinds inventory. Its hypothetical mean mass also needs a real passenger list before it can become an engineering estimate.
Space does not settle nutrition. Pandas need suitable bamboo; other specialists require particular plants or prey. Dry hay cannot replace all those diets, and juveniles still need appropriate food. Maintaining fresh supplies, preventing spoilage, and provisioning specialist feeders remain biological problems even when a storage calculation fits. Further reading: Smithsonian National Zoo, supplying bamboo for pandas.
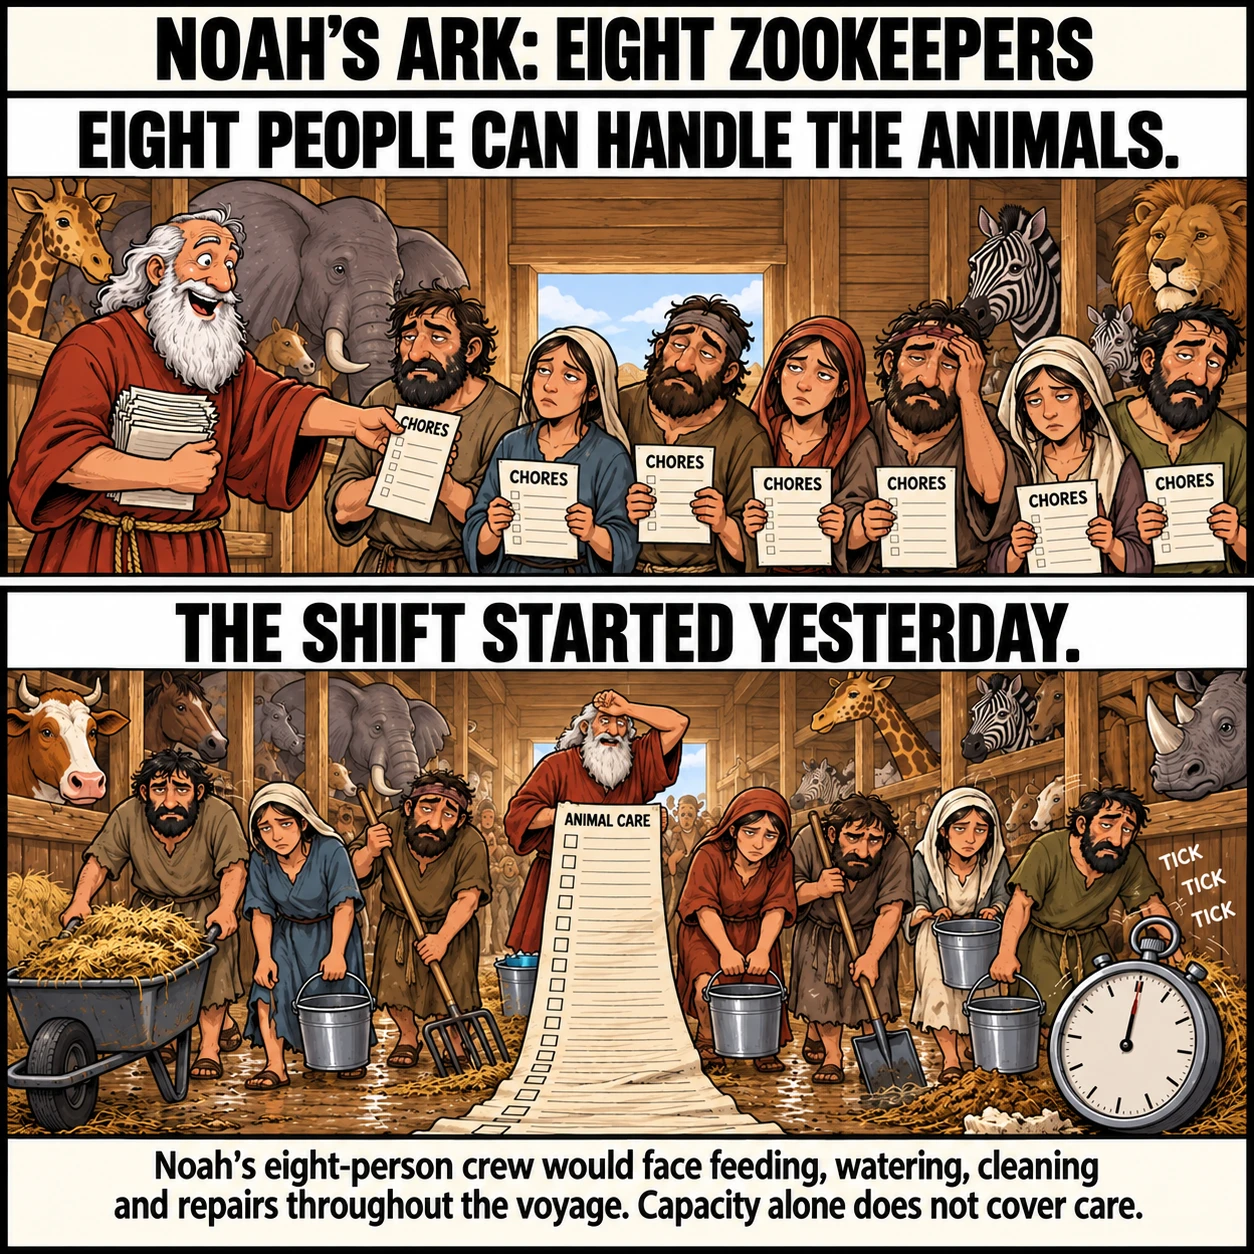
38. The animal-care workload strains an eight-person crew
Keep the same 6,744-animal inventory. Give all eight people a demanding sixteen-hour workday, every day, with no sickness or injury. Available labour = 8 × 16 = 128 worker-hours per day. Feeding, watering, cleaning, health checks, and ship maintenance must share that budget.
At two minutes of attention per animal per day, demand = 6,744 × 2 ÷ 60 = 224.8 worker-hours. That requires about fifteen people working sixteen hours each. With eight people, the absolute budget is 128 × 3,600 ÷ 6,744 ≈ 68 seconds per animal per day, before cooking, repairs, food preparation, or any other task. At the 80,000-animal vertebrate comparison, it falls below six seconds.
Two minutes is an illustrative workload, not an established biological minimum. Group feeding, gravity-fed water, and other systems could reduce individual handling. To test a grouped arrangement, assume one enclosure for each of 1,398 kinds and just five minutes of service twice a day. That requires 1,398 × 5 × 2 ÷ 60 = 233 worker-hours daily. A successful proposal needs a layout and routine that brings the whole workload within 128 hours, including maintaining whatever equipment saves labour.
Waste also has to move. If each animal produces an assumed average one kilogram of wet waste daily, the crew handles about 6.7 tonnes per day, or 2,462 tonnes over 365 days. That is a workload scenario, not a measured excretion rate for the collection, and wet waste includes water already consumed. Channels could reduce carrying, but would need reliable drainage, cleaning, and protection against flooding.
Ventilation and disease control cannot be inferred from animal counts alone. It is too simplistic to declare that one biblical "window" makes survival impossible because its meaning and geometry are debated. The practical objection is that a working system must keep thousands of different animals healthy within a severe labour budget. The Association of Zoos and Aquariums publishes species-specific manuals precisely because care requirements differ. Further reading: AZA animal care manuals.
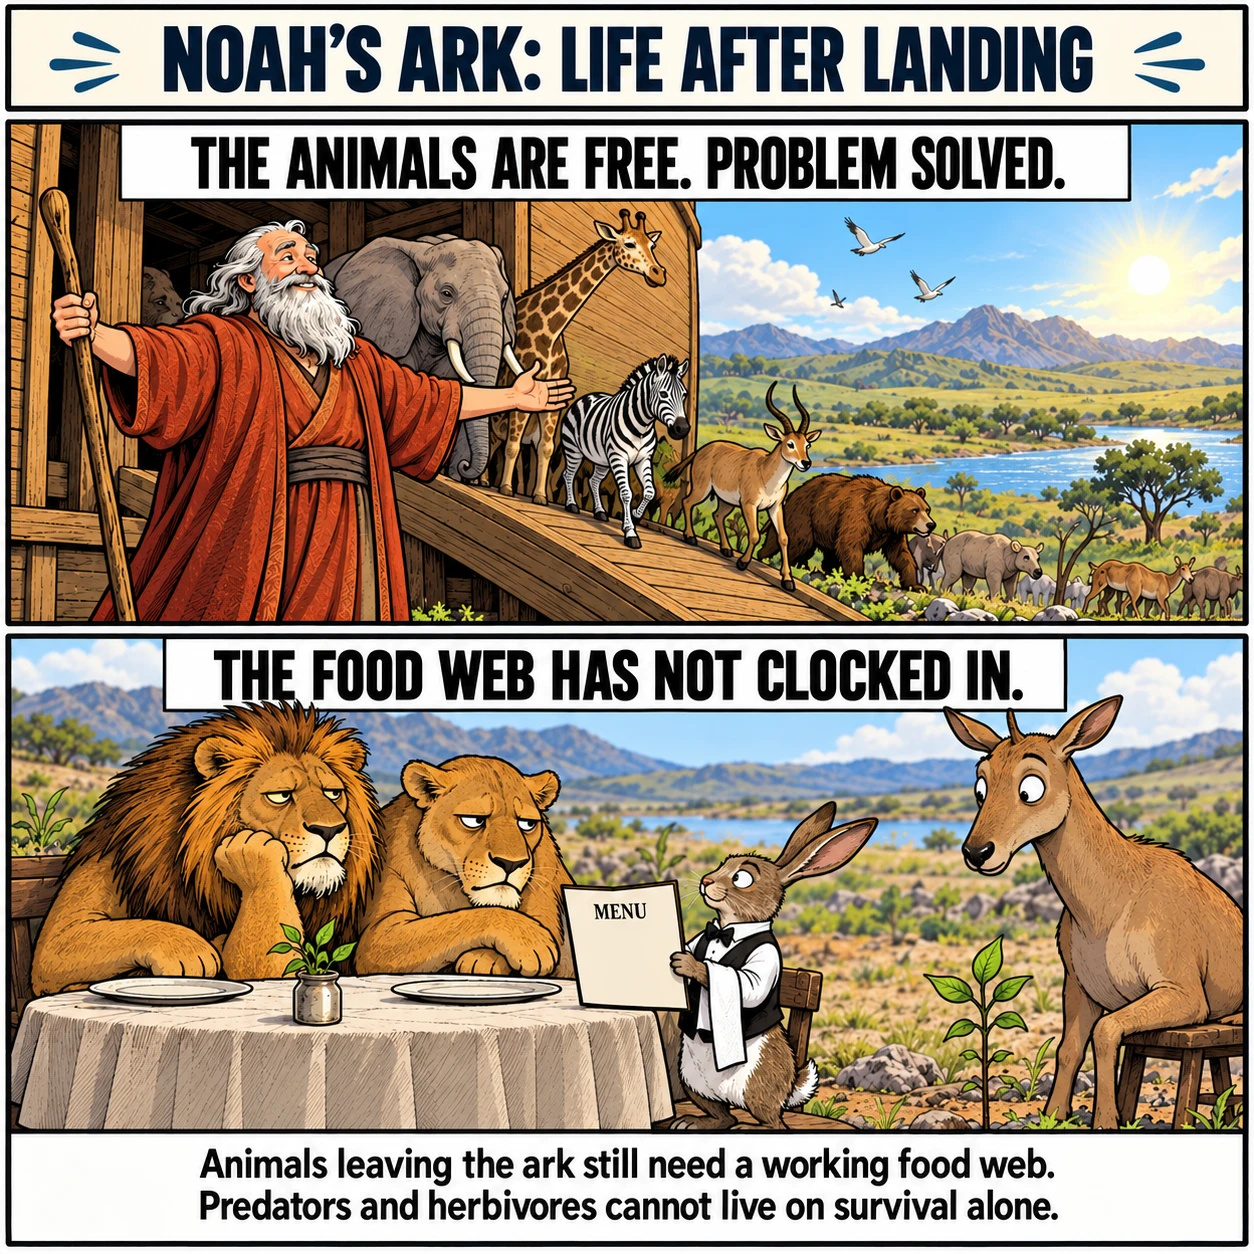
39. Predators need prey before depleted populations can recover
Releasing surviving animals does not instantly create a functioning food web. Predators must eat while prey populations are still small. Herbivores need vegetation before that vegetation has recovered. The time between release and successful reproduction matters.
An illustrative pair of large predators eating five kilograms of meat each per day requires 2 × 5 × 365 = 3,650 kg of meat in a year. At an assumed 50 kg of edible meat per prey animal, that is 73 prey animals annually for just one pair. These are round assumptions, not a universal lion ration or a claim that every kill has the same yield. They show why releasing two of each animal does not supply a year's prey budget. Further reading: Smithsonian National Zoo, lion ecology and diet.
The familiar claim that a lion must immediately eat the only two zebras is too crude. Predators can use multiple prey species, and Genesis includes larger numbers of some animals. But distributing predation across several founding populations still removes animals needed for recovery. Some founders must reproduce before their descendants can replace those losses, and young prey also need food and time to grow.
Stored meat or carrion might bridge a gap. In the example, a six-month bridge alone needs roughly 1.8 tonnes of edible meat for one pair, with a way to preserve it. A complete recovery model needs those quantities across predator populations, alongside herbivore diets and plant regrowth. Counting survivors at the moment they leave the ark does not establish that the resulting communities can sustain themselves.
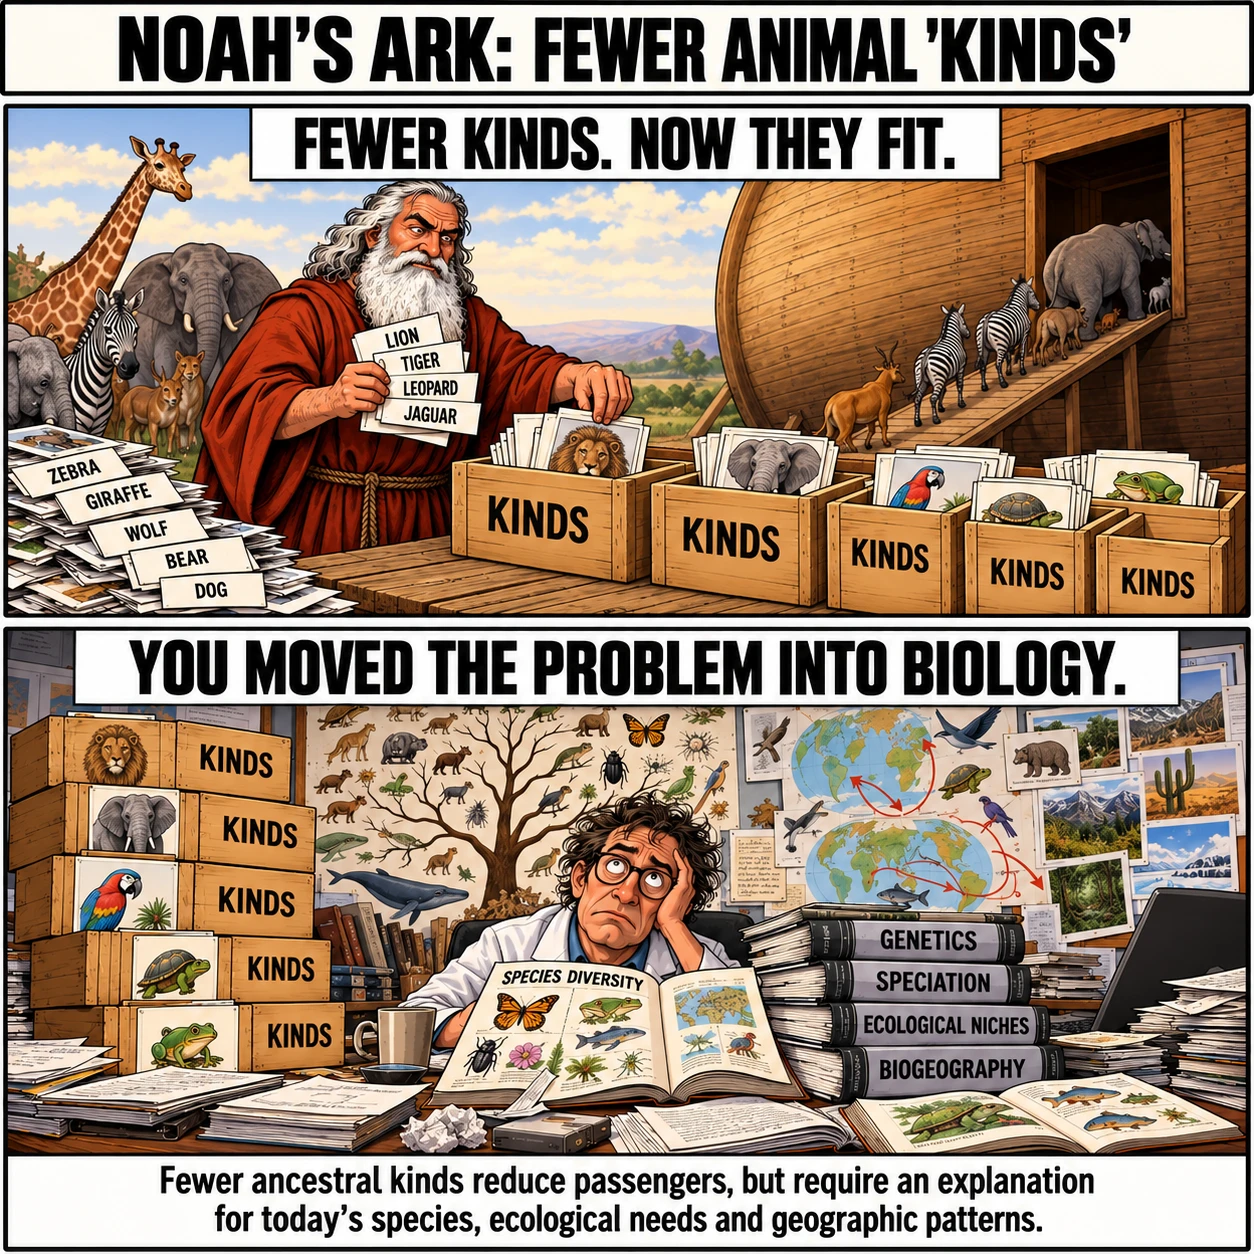
40. Reducing the passengers to a few "kinds" demands extraordinary diversification afterward
Using broad ancestral "kinds" reduces the passenger count. It also means that many descendant species, their ecological differences, and much of their genetic variation must emerge after the flood.
Use 1,398 founding kinds and a rounded target of 40,000 vertebrate species as a schematic comparison. That is 40,000 ÷ 1,398 ≈ 29 descendant species per founding kind on average. In an assumed 4,500 years, the increase requires at least 40,000 − 1,398 = 38,602 net additions, approximately 8.6 per year across the entire collection. This generously assigns every founding kind a surviving contribution, even though the proposed inventory includes extinct groups. An actual mapping would also have to remove aquatic exclusions from the target and account for extinctions.
That global average is not, by itself, an impossible rate. It would be wrong to portray it as 8.6 new species per kind per year. The difficulty is producing the particular genetic distances, reproductive barriers, fossil histories, adaptations, and geographical distributions we observe within the allotted time.
Rapid evolution is real. Lake Victoria cichlids provide an example of hundreds of species arising over a relatively short geological interval. Research shows that inherited variation and ancient hybridization helped make that diversification possible. A radiation with that documented history does not establish that nearly all land-animal diversity arose recently from isolated paired founders.
The smaller inventory therefore moves much of the explanatory burden from accommodation to biology. Its proposed ancestors and their descendants must be specified and tested against genetic evidence. Adjusting the word "kind" until the animals fit the boat does not demonstrate the required evolutionary history. Further reading: Meier and colleagues, ancient hybridization and rapid cichlid diversification.
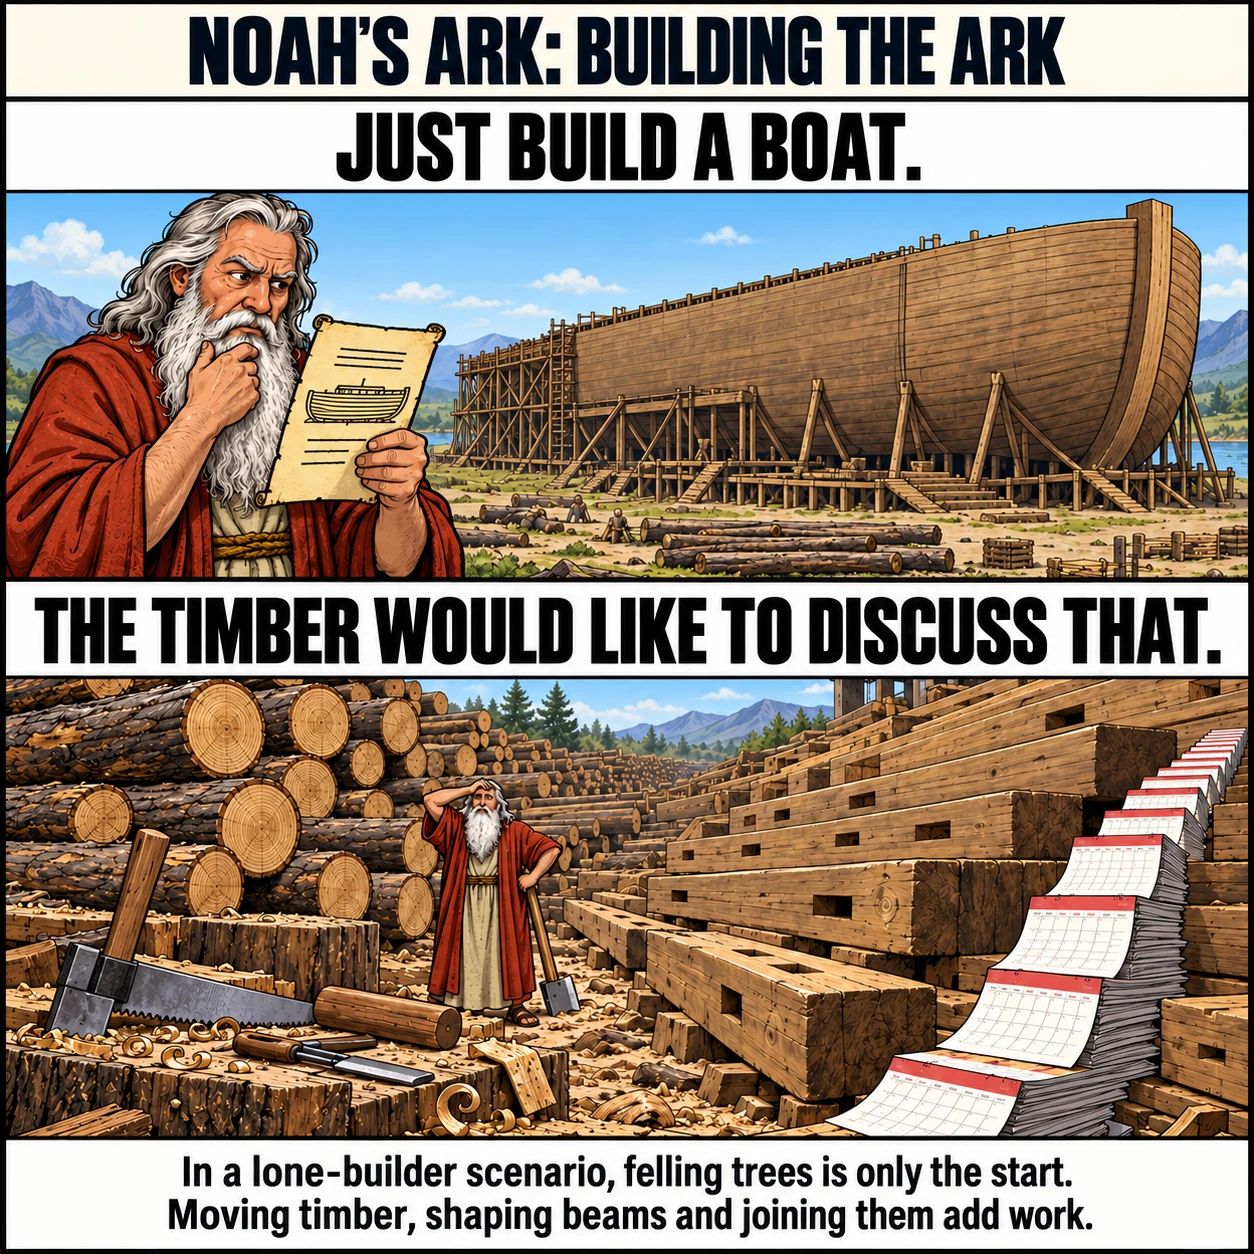
41. A lone builder faces more than a century of timber work and assembly
Building the ark means turning a forest into a watertight vessel 135 metres long. The work includes felling trees, making planks and beams, cutting joints, moving heavy components into place, and sealing thousands of connections. Here is a step-by-step labour budget for one person building without nails or modern construction equipment. The quantities and work rates below are stated assumptions, with archaeological experiments used as reference points.
First, count the available workdays
Assume Noah works Monday through Saturday, ten hours a day, every week. Using 52 weeks per year gives 6 × 52 = 312 workdays, or 3,120 working hours annually. There are no holidays, sick days, or weather stoppages in this budget.
Keep the article's 135 × 22.5 × 13.5 metre rectangular model. Its bottom, roof, sides, and ends total about 10,328 m². At an assumed timber thickness of 15 cm, those surfaces require 10,328 × 0.15 ≈ 1,549 m³ of wood. Two interior decks, each 135 × 22.5 metres and 10 cm thick, add about 608 m³. Add 40% of that subtotal for frames and bracing, and the total is approximately 3,000 m³ of finished timber.
Assume half the harvested log volume becomes usable timber after removing bark, unsuitable wood, and cutting waste. Required logs = 3,000 ÷ 0.50 = 6,000 m³. At an average three cubic metres of usable log per tree, Noah must cut down 6,000 ÷ 3 = 2,000 trees. If the forest contains 100 suitable trees per hectare, that means harvesting across 20 hectares, or 200,000 m². The density and yield are assumptions about the supply he would need, not a reconstruction of an identified forest.
Felling the trees
Assume an average of two working hours per tree across the whole stand, including moving between trees, setting up, and sharpening during felling. That is 0.5 trees per hour, or five trees per ten-hour day. Cutting down all 2,000 trees takes 4,000 hours: 400 workdays, approximately 1.3 working years.
This average is a planning assumption. Experimental archaeology shows that felling time changes with tree size, wood, tools, and technique; John Coles describes felling and splitting experiments. The 400 days cover getting the trees down. The logs still have to become ship timber.
Turning logs into planks and beams
For a manageable calculation, represent the 3,000 m³ as 20,000 pieces averaging 0.15 m³ each. A plank five metres long, 30 cm wide, and 10 cm thick has that volume. Actual beams and planks would vary; this is an average unit for counting work.
Allow eight worker-hours per average piece for debarking its share of the log, splitting, trimming to size, and smoothing the faces and edges. That assumed rate is 0.125 finished pieces per hour, or 1.25 per ten-hour day. Processing all the timber takes 20,000 × 8 = 160,000 hours: 16,000 workdays, approximately 51.3 years. Joint-cutting and installation are counted separately below.
For this nail-free build, use fitted timber, wooden fasteners, and lashings. Archaeologist Cheryl Ward describes fitted joints and rope lashings in an ancient Egyptian vessel in NOVA's shipbuilding investigation. Every connection requires preparation; a rope cannot fasten two solid planks without holes or another means of attachment.
The experimental Bronze Age boat Morgawr provides a useful labour reference. Its researchers estimated one hour to cut a lashing hole by hand, plus at least fifteen minutes to smooth and finish it. Use that 1.25-hour rate, and assume an average eight fastening holes per timber piece. Hole-making alone takes 20,000 × 8 × 1.25 = 200,000 hours.
Add an assumed two hours per piece for final fitting, positioning, fastening, and sealing: another 40,000 hours. Assembly therefore totals 240,000 hours, or 24,000 ten-hour workdays: approximately 76.9 years. The hole count and fitting allowance describe this construction model; different connections would require their own labour calculation.
Moving the timber adds a physical challenge. At an assumed density of 600 kg/m³, the average 0.15 m³ piece weighs 90 kg. A ten-metre beam with a 30 cm square cross-section weighs 540 kg. Without powered cranes or lifting equipment, installing such pieces requires prepared supports, ropes, and manual lifting arrangements, all of which must themselves be made and maintained.
Add the stages together
Felling 400 days + processing 16,000 days + assembly 24,000 days = 40,400 workdays. At six ten-hour days every week, that is approximately 129.5 years for one worker. This model exceeds the 75-year allowance by about 54.5 years and even the 120-year allowance by about 9.5 years.
The total still excludes hauling timber from the forest, producing the tools, ropes and waterproofing materials, building the lifting arrangements, and repairing work exposed to decades of weather. It also excludes collecting the animals and their provisions. Under these stated work rates, the lone builder runs out of time before those additional jobs even begin. The story's short instruction to build an ark conceals hundreds of thousands of hours of manual work.
What the evidence establishes
The strongest case against a recent global flood comes from records that continue through the proposed catastrophe. Trees kept growing, environmental archives kept recording local conditions, and human populations retained ancestry incompatible with a recent restart from Noah's family. These are observations the literal account must explain.
The rocks also record environments and sequences of events that conflict with attempts to compress geological history into the flood year. Physical and biological constraints add further objections. The water needs a source and a destination. Aquatic organisms must survive the changed conditions. The ark's eight occupants must keep their animals fed, housed, and healthy for roughly a year, and the survivors must then rebuild viable populations and food webs.
These objections address the story's compatibility with the evidence and the feasibility of the voyage. The five claims below have a different role: they offer particular discoveries or traditions as supposed confirmation. Showing that a boat-shaped formation is natural rock removes that claimed confirmation, but does not itself prove the ark story false.
People may read Noah's story as theology, literature, or a transformed memory of regional disaster. Those readings do not require a mountain-covering global flood to have happened. As an account of Earth's recent physical and biological history, the literal global-flood story is contradicted by the evidence.
debunking common rebuttals
These five claims present discoveries or traditions as positive evidence that Noah's ark or a worldwide flood was real. Each response examines whether that supposed evidence establishes the claim. They are separate from the 41 numbered objections above. The claim headings paraphrase the arguments rather than quote particular advocates.
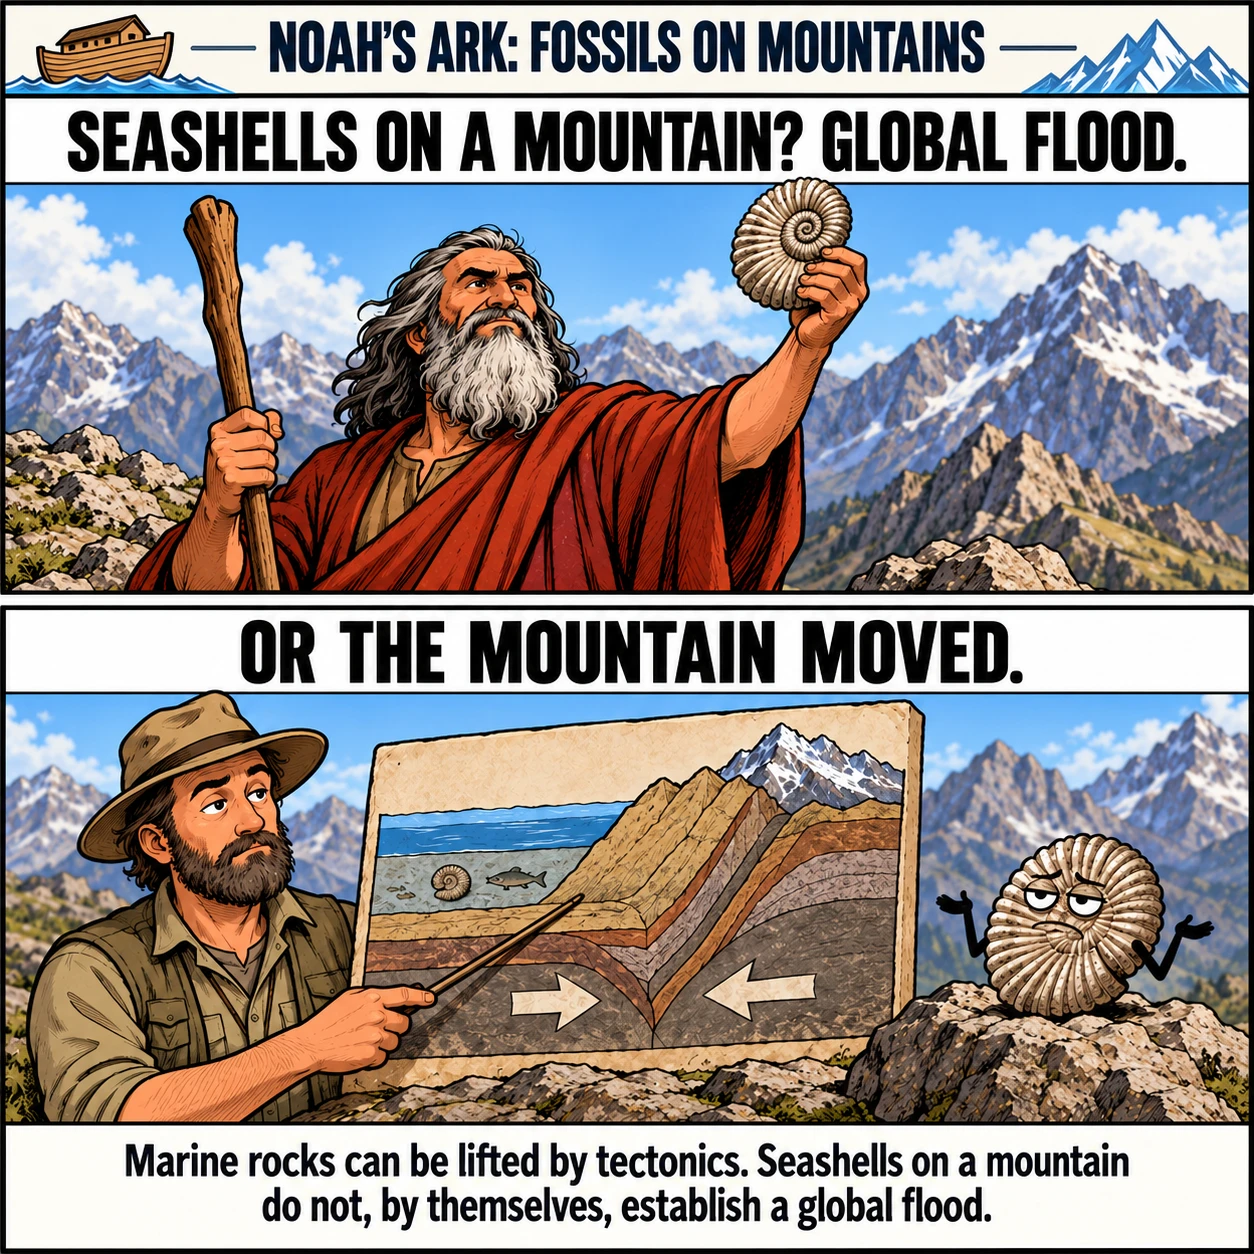
Claim: Marine fossils on mountains prove a global flood
Finding a marine fossil high above sea level is sometimes presented as direct proof that floodwater once covered the mountain. But a rock can move upward after forming beneath the sea.
The Himalayas provide an exceptionally clear example. India collided with Eurasia, compressing, deforming, and thickening the crust. Marine sedimentary rocks became part of an enormous mountain belt. USGS describes evidence that this collision began tens of millions of years ago and continues today.
The fossil establishes that its original environment was marine. It does not establish that seawater reached the rock's present elevation while the mountain already had its present shape. Confusing those two propositions removes the mountain's geological history from the argument.
Uplift explains the fossils together with folds, faults, crustal structure, and plate motion. A global flood is unnecessary and does not explain those associated observations. This method disproves a widely repeated argument for the flood rather than independently proving that no flood could ever occur.
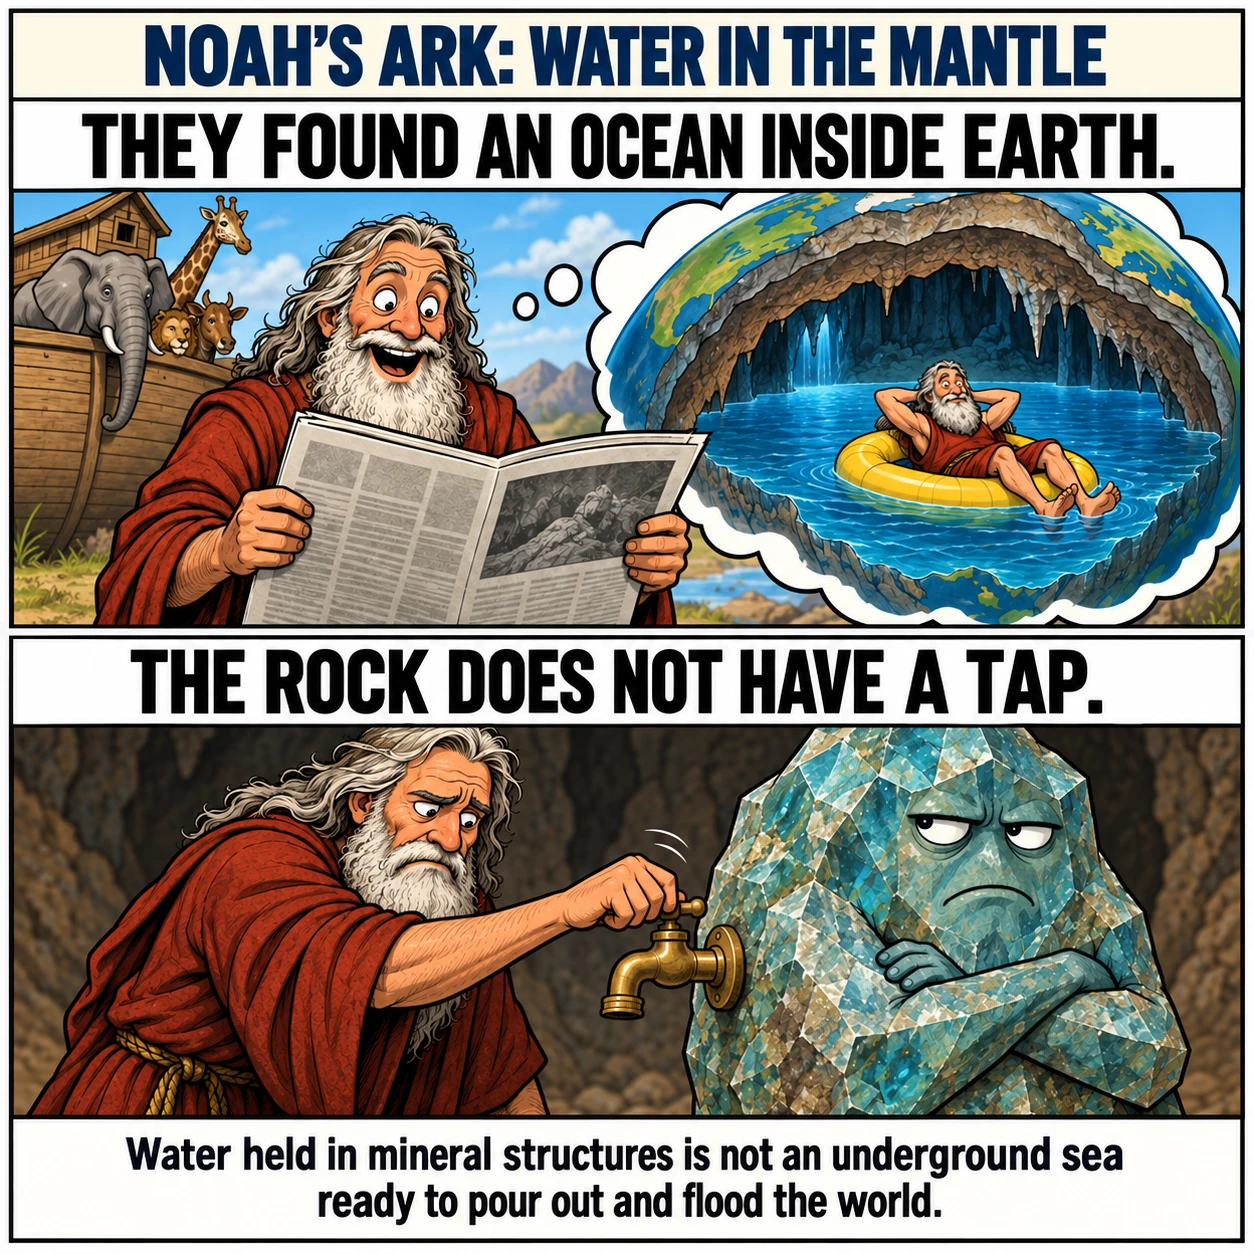
Claim: Deep mantle water confirms the biblical fountains of the deep
Research has found evidence for water stored in minerals deep within Earth. A hydrous ringwoodite inclusion in a diamond helped demonstrate that the mantle transition zone can contain substantial water associated with its mineral structures.
Popular descriptions sometimes turn this into an underground sea. That is misleading. Water-bearing minerals hundreds of kilometres down are not equivalent to a vast open cavern full of liquid that can drain onto the surface overnight.
Using this reservoir for Noah's flood requires a mechanism to release the water from rock, transport it upward, handle the accompanying heat and geological change, and later account for where it went. The discovery of mantle water supplies none of those steps on a flood timescale.
This evidence does not establish that Earth's deep interior contains little water. It establishes why "scientists found underground oceans" does not validate the fountains-of-the-deep explanation. A reservoir's possible size and its availability for a particular event are separate physical questions.
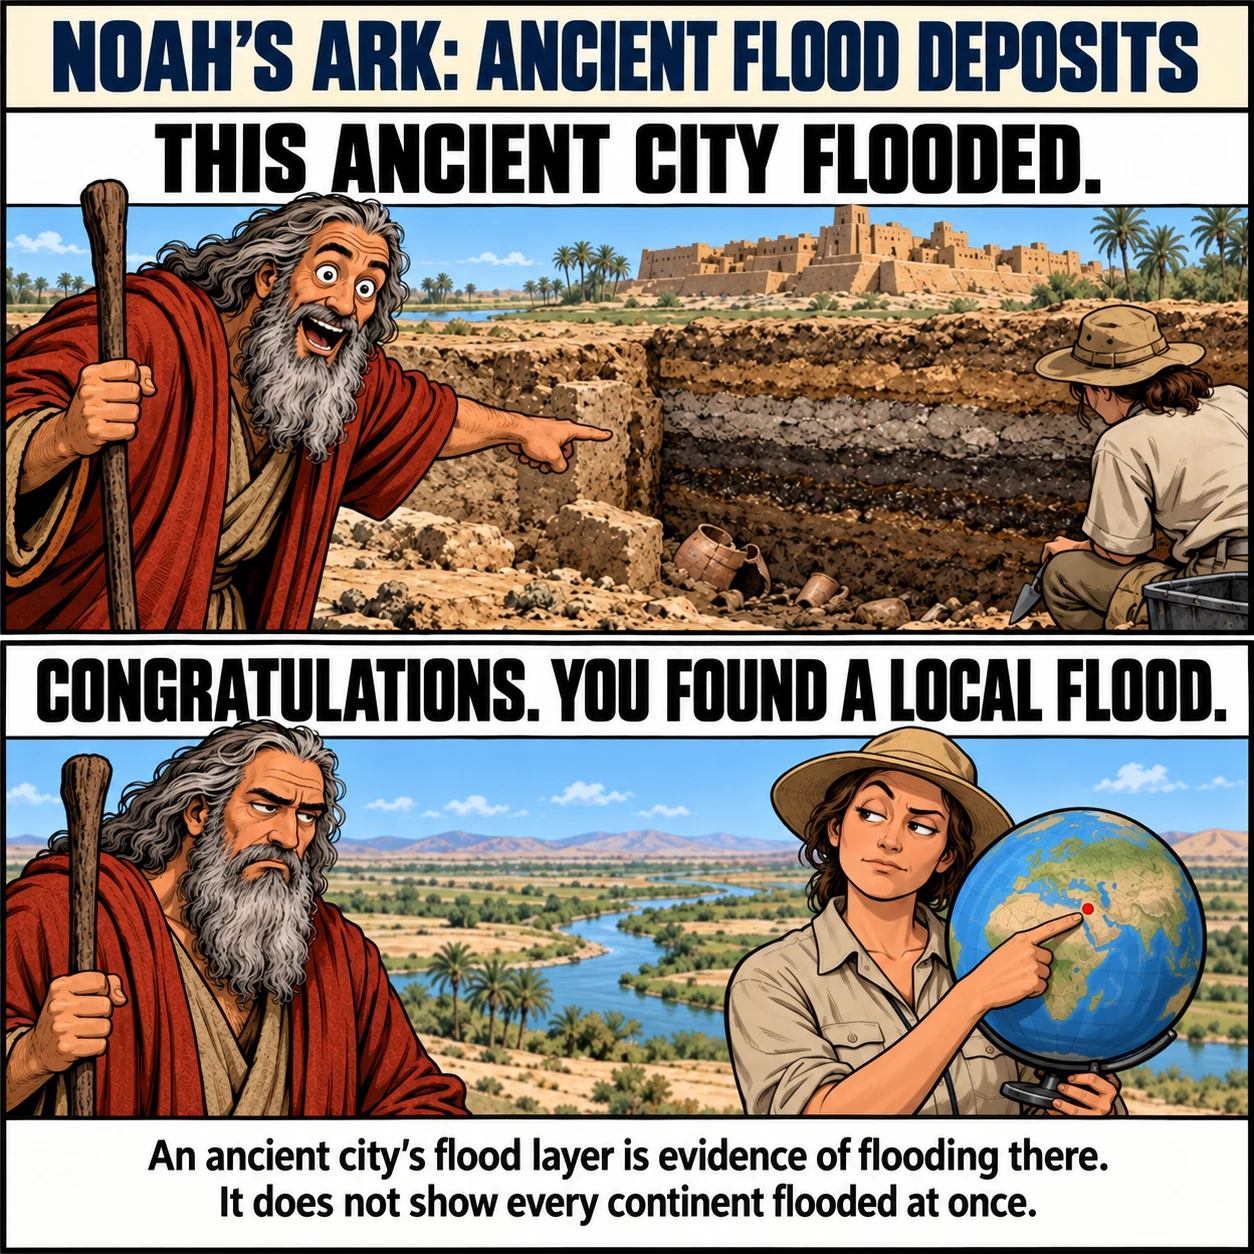
Claim: Ancient flood deposits confirm a worldwide flood
Archaeologists have found substantial flood deposits in Mesopotamia. That is expected in a region built around large rivers. The important question is whether the deposits represent one event everywhere.
The flood layers discussed at Ur, Kish, and other sites belong to different archaeological contexts. Samuel Noah Kramer's review explains why the evidence cannot simply be assembled into one universal inundation. A thick local deposit establishes a flood at that location; it does not establish that the Himalayas, Australia, and Egypt were underwater at the same time.
The proposed Black Sea flood is also regional. Researchers have debated its timing and magnitude. Whatever the resolution, water entering the Black Sea is not evidence of a global ocean above every mountain.
Such disasters could have contributed to flood traditions. Identifying the precise event behind a particular story is harder. A plausible local inspiration would explain how a story began while contradicting its interpretation as a literal record of worldwide destruction.
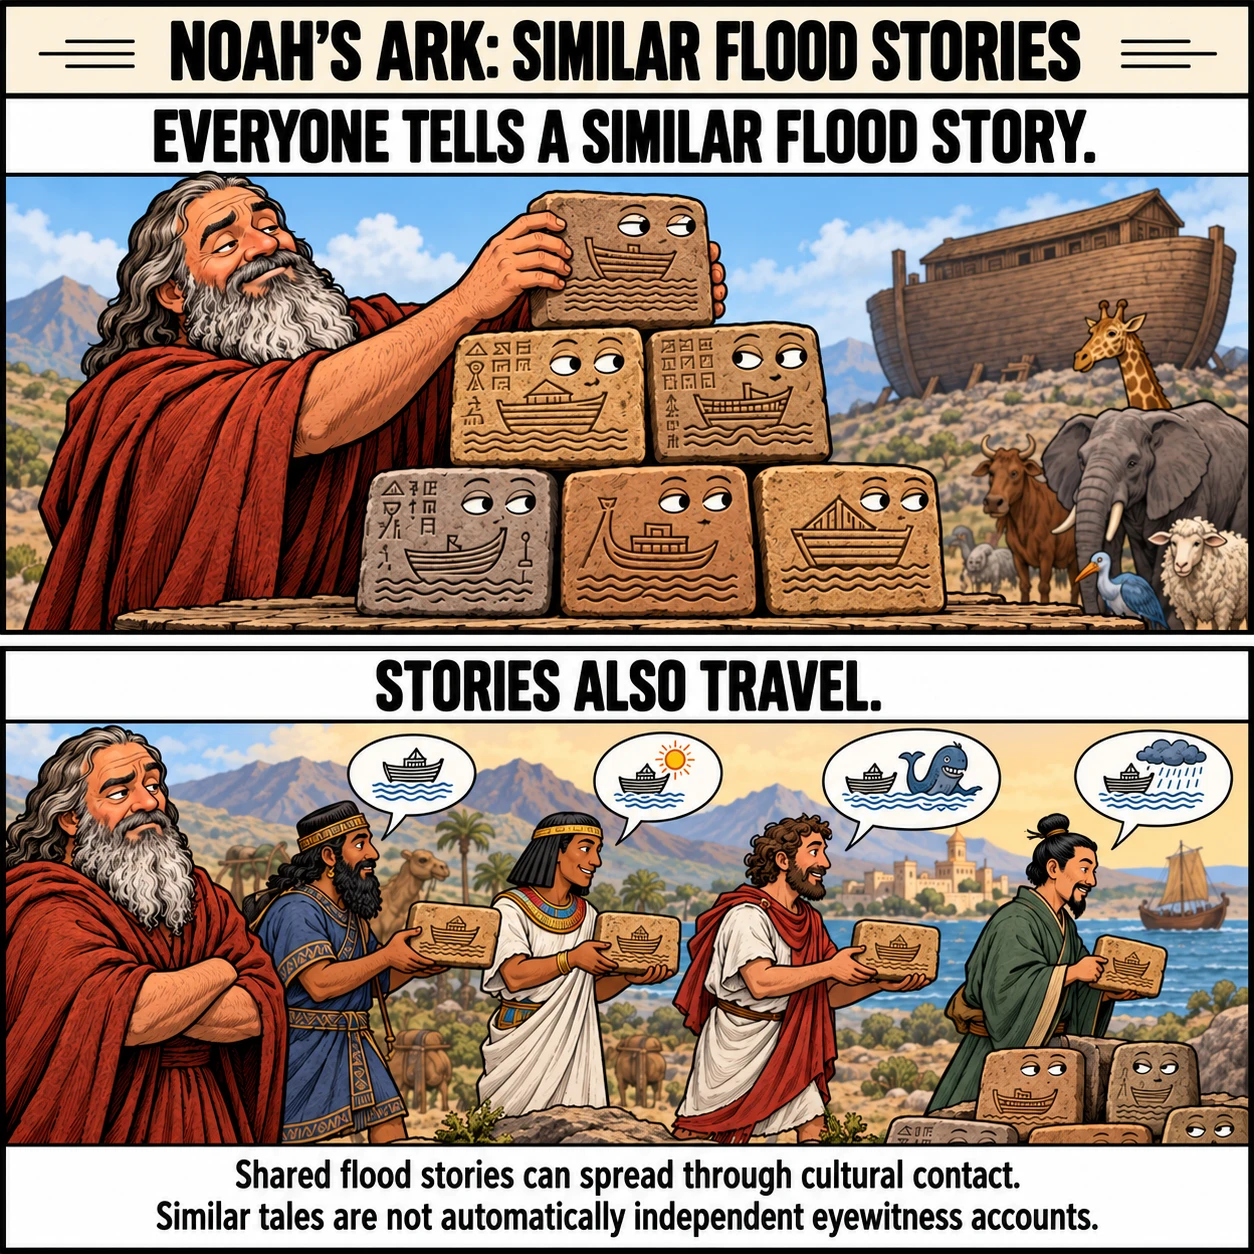
Claim: Similar flood stories independently confirm Noah's flood
The Sumerian flood story describes a chosen survivor, a divine warning, a boat, a destructive flood, and an offering after survival. Related Mesopotamian narratives include the flood episode in the Epic of Gilgamesh, whose famous tablet is held by the British Museum.
These are physical texts that can be studied, translated, and compared. The Sumerian tablet discussed by Penn Museum dates to the early second millennium BCE. Flood storytelling therefore has a long documented history in the ancient Near East.
Shared motifs support the interpretation of Genesis within that literary tradition. They do not establish a simple copying chain for every detail, and an earlier story cannot logically prove that no real disaster inspired either version.
What they undermine is the argument that similar stories constitute independent eyewitness confirmation of a worldwide flood. Stories can circulate, change, and serve different religious purposes. Their similarities must be assessed as evidence of cultural transmission as well as possible memories of disasters. Geological scale cannot be established by counting legends.
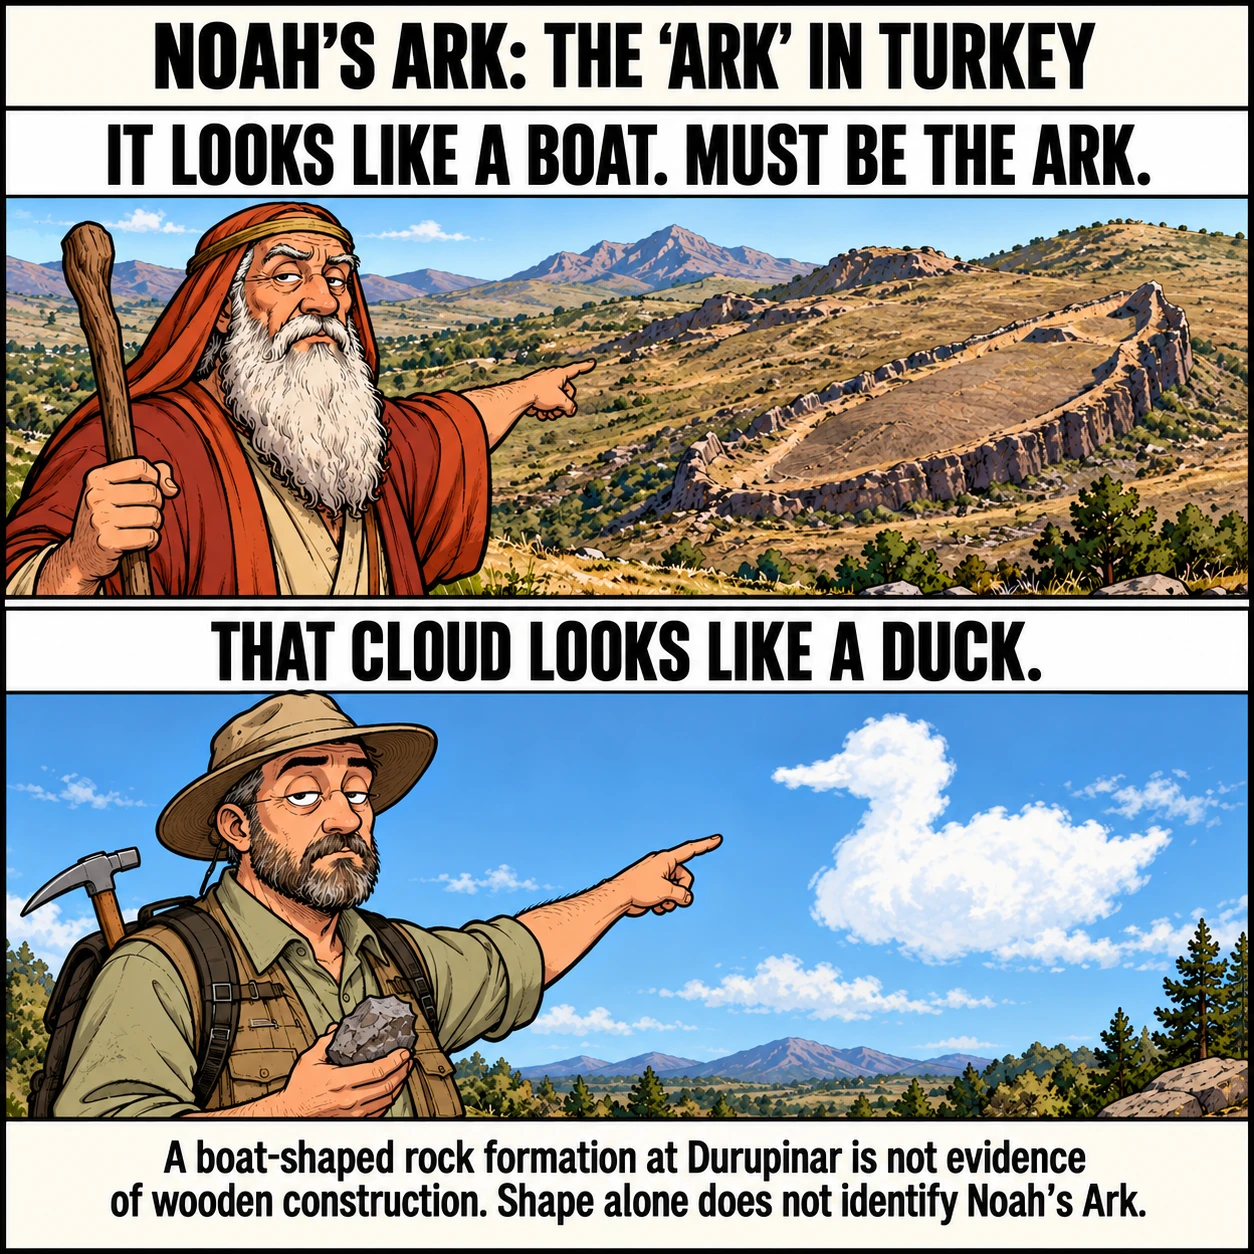
The Durupinar formation in eastern Turkey has repeatedly been promoted as Noah's ark. Its outline resembles a boat, but resemblance is not sufficient archaeological evidence.
Geologist Lorence Collins and former ark proponent David Fasold examined claims about the formation and published an explanation based on natural geology. Their investigation challenged supposed ship features, including interpretations of iron-rich material as fittings. Collins later revised details of his geological interpretation while continuing to explain the formation as natural rock rather than a vessel.
An authenticated wooden ship would require diagnostic construction evidence and securely documented context. Radar shapes, suggestive outlines, or material collected nearby do not by themselves identify a ship, much less its owner and voyage.
The absence of a confirmed ark is not the strongest argument against the story. Wooden structures can disappear. This section instead rejects the claim that Durupinar supplies positive confirmation. Even a genuine ancient ship at altitude would require a separate explanation of how it arrived there and would not automatically prove a worldwide flood.